
<div class="text-justify">
## Question 1 - In your own words, give a simplified explanation of the CMF indicator with an example of how to calculate its value?
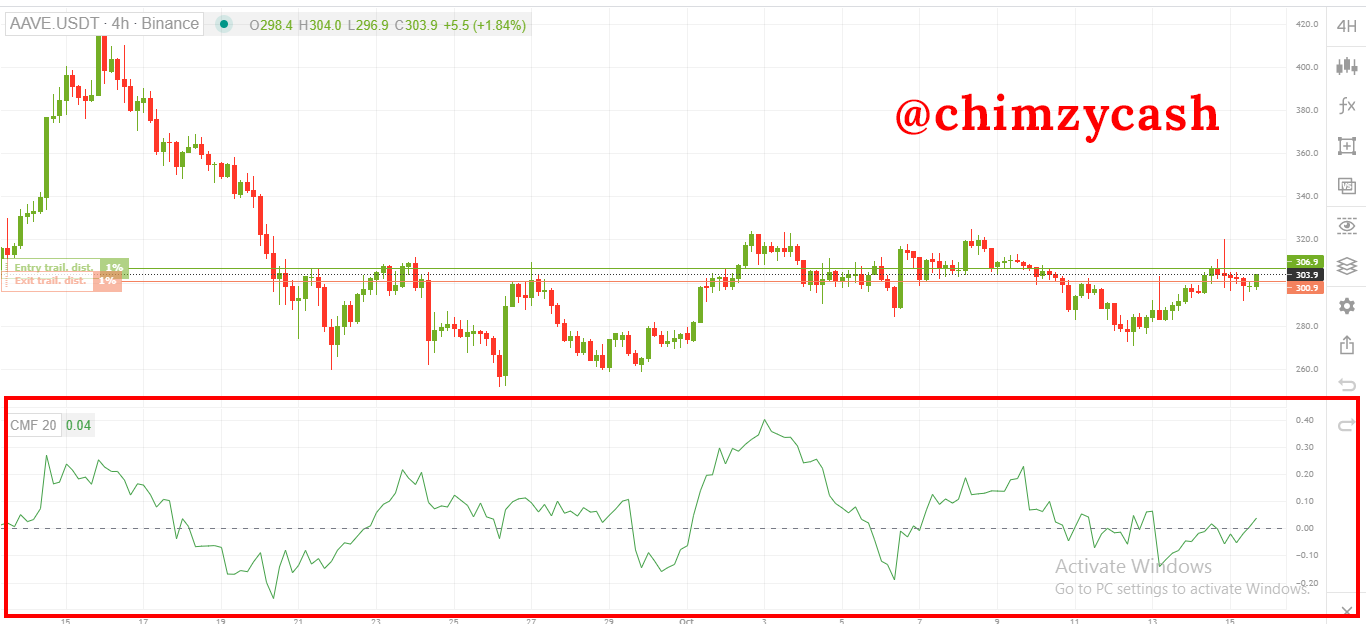
The CMF indicator which is the short for the Chaikin Money Flow Indicator is basically a technical indicator that measures the volume-weighted average of accumulation and distribution of any cryptocurrency asset over a particular period of time. The CMF indicator has proven to be a very powerful indicator for identifying trends in the market. The CMF indicator was developed in the 1980s by Marc Chaikin with the sole purpose of monitoring and measuring the accumulation and distribution of an asset over a particular period of time. The Chaikin Money Flow Indicator has a default period value of 21.
The CMF indicator oscillator moves between +1 and -1. When the CMF oscillator line moves above 0 or moves below 0, it can strongly indicate that there are changes in the money flow and also the buying momentum and selling momentum. When the CMF oscillator line moves into the positive readings above 0 and remains above 0, it indicates that buying pressure is present in the market and the strength of the uptrend. When the CMF oscillator line moves into the negative readings below 0 and remains below 0, it indicates that selling pressure is present in the market and the strength of the downtrend. Also, When the CMF oscillator line ranges around the 0 center line and moves between -0.05 and 0.05 values, this indicates that there is indecision in the market or decision making period in the market and that the buying pressure and selling pressure are relatively at an equilibrium. This means that there isn’t any clear market direction or trend.
.png)
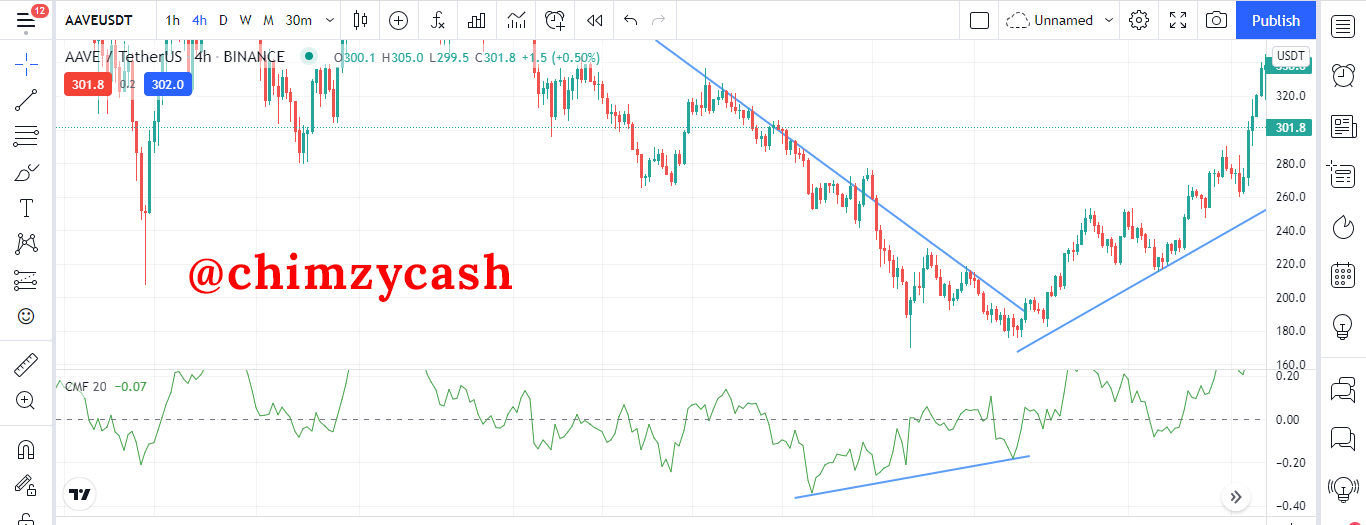
CMF indicator on the AAVE/USDT Chart
### Chaikin Money Flow Calculation
When it comes to calculating the Chaikin Money Flow, there are three steps that needs to be calculated; Money flow multiplier, Money flow volume and the CMF value.
#### Calculating the Money Flow Multiplier (MFM)
MFM = (CV – LV) – (HV – CV) / (HV – LV)
#### Where;
Closing value = CV
Highest value = HV
Lowest value = LV
#### Calculating the Money Flow Volume (MFV)
MFV = (MFM) x (PV)
#### Where;
Money Flow Multiplier = MFM
Period Volume = PV
#### Calculating the CMF value
CMF = (N Average of the set period Money Flow Volume) / (N Average of the Volume)
#### Where;
Number of periods = N
**Let’s take for instance, AAVE/USDT**
Closing value (CV) = $350
Lowest value (LV) = $315
Highest value (HV) = $368
Period Volume (PV) = $85,845
Total period volume (TPV) = $9,854,630
Number of periods (N) = 21
#### Calculating Money Flow Multiplier (MFM)
Using MFM = (CV – LV) – (HV – CV) / (HV – LV)
MFM = (350 - 315) - (368 - 350) / (368 – 315)
MFM = (35) - (18) / (53)
= 17 / 53
= 0.3208
MFM = 0.32
#### Calculating Money Flow Volume (MFM)
Using MFV = (MFM) x Period Volume
Money Flow Multiplier (MFM) = 0.32
Period Volume (PV) = $85,845
MFV = 0.32 x $85,845
MFV = 27,470.4
### Calculating CMF
Using CMF formula
CMF = 27,470.4 / $9,854,630
CMF = 0.0028
Therefore,
The CMF = 0
This means that the CMF oscillator line is around the 0 center line. This indicates that there is indecision in the market and neither buyers nor sellers are in control of the market at that particular period of time.
<br>
## Question 2 - Demonstrate how to add the indicator to the chart on a platform other than the tradingview, highlighting how to modify the settings of the period (best setting)
### Adding the CMF indicator using the GoodCrypto platform
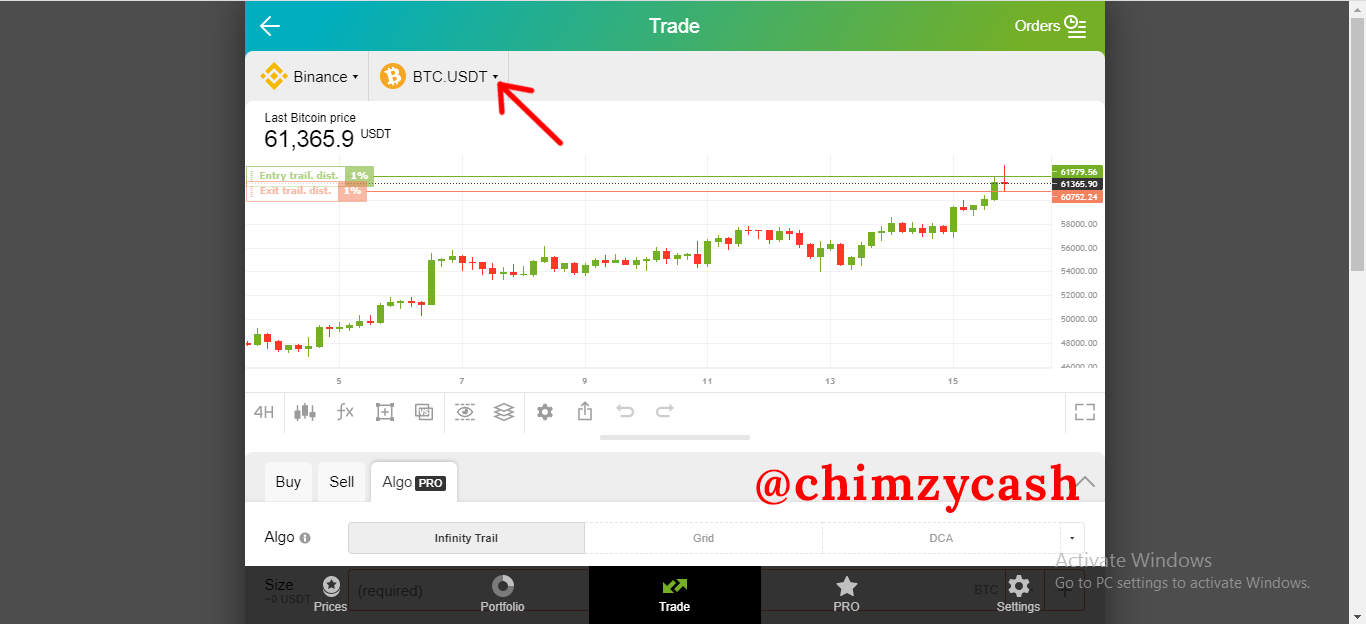
To add the CMF indicator on a chart, I will making use of the goodcrypto platform https://app.goodcrypto.app. The trade interface on goodcrypto https://app.goodcrypto.app/trade provides the charting tools.
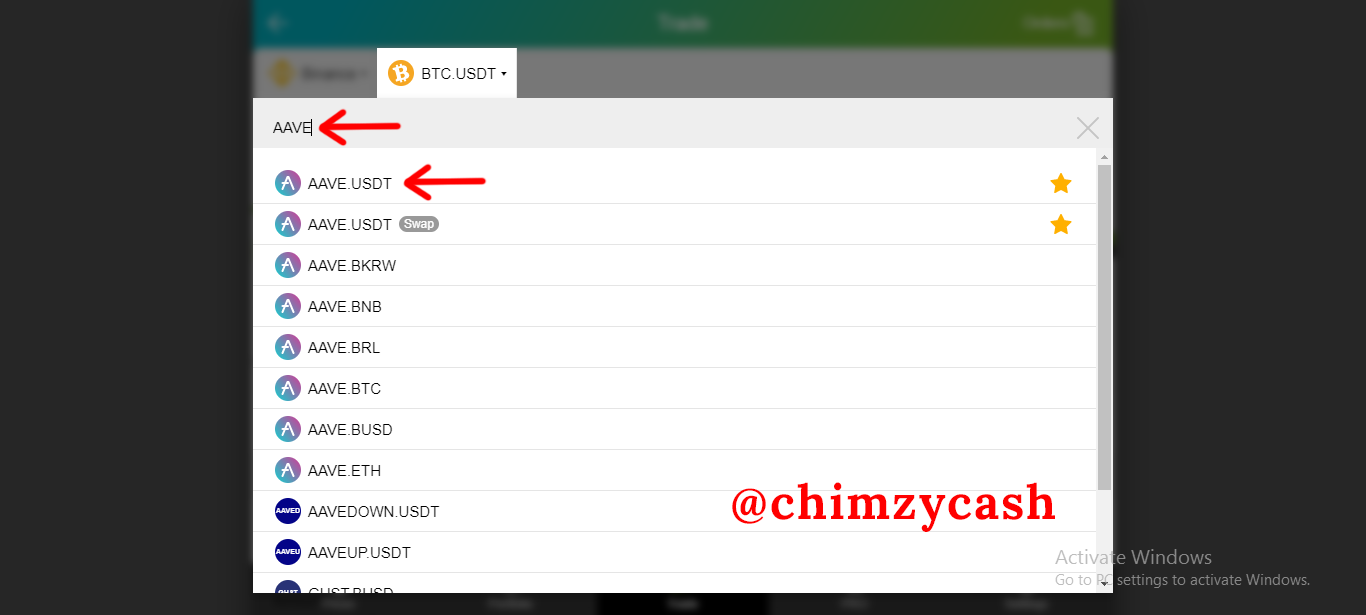
* Click on the dropdown of the crypto pair and search for the desired cryptocurrency to add on the chart. For this, I will be using the AAVE/USDT pair.
.png)
.png)
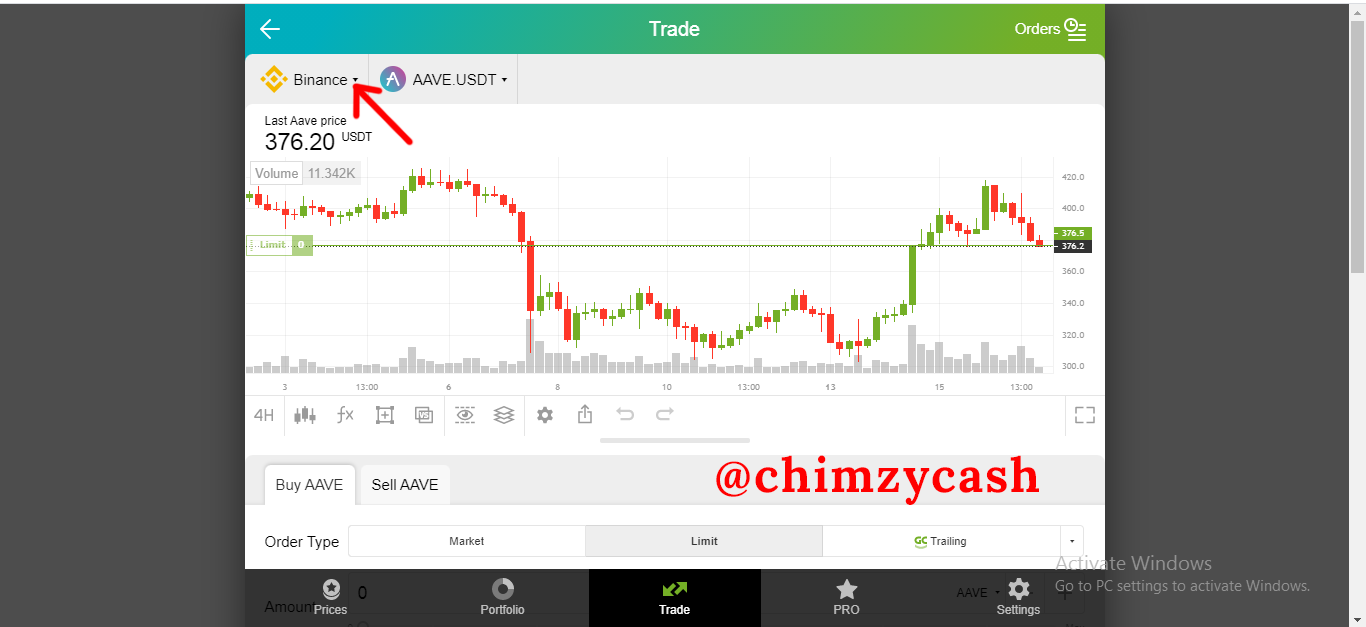
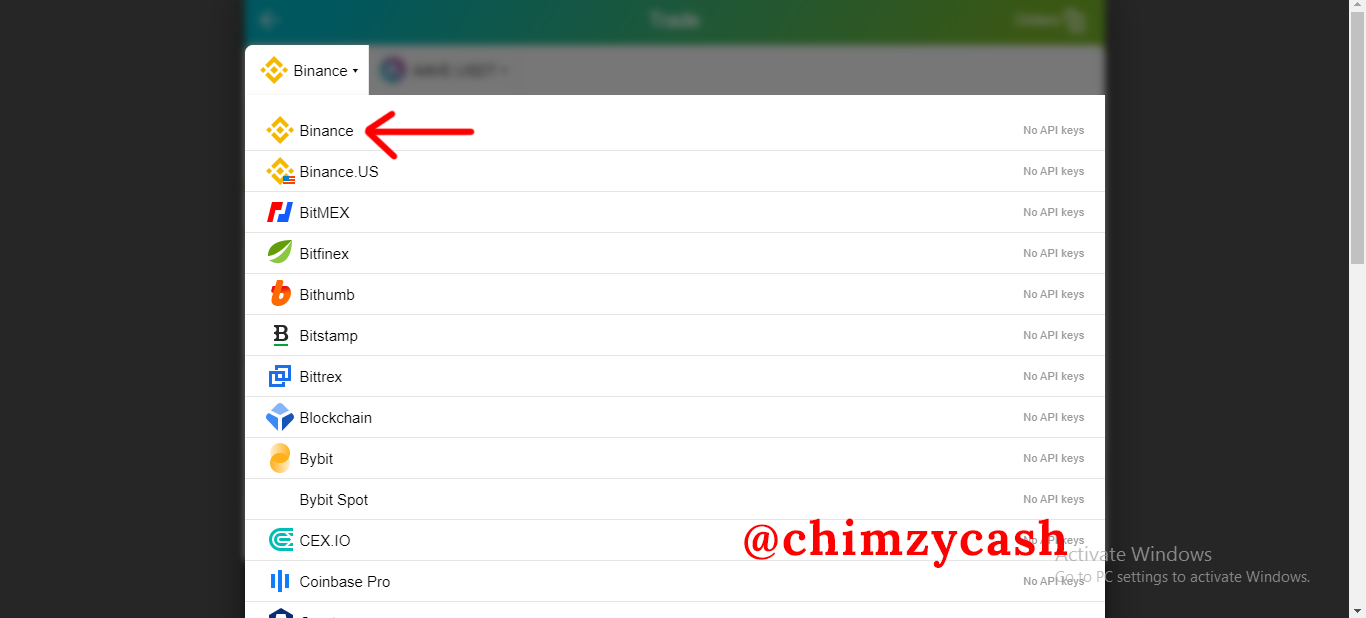
* To change the exchange for the particular crypto pair, click on the dropdown of the exchange and choose the desired exchange. For this, I chose the Binance exchange.
.png)
.png)
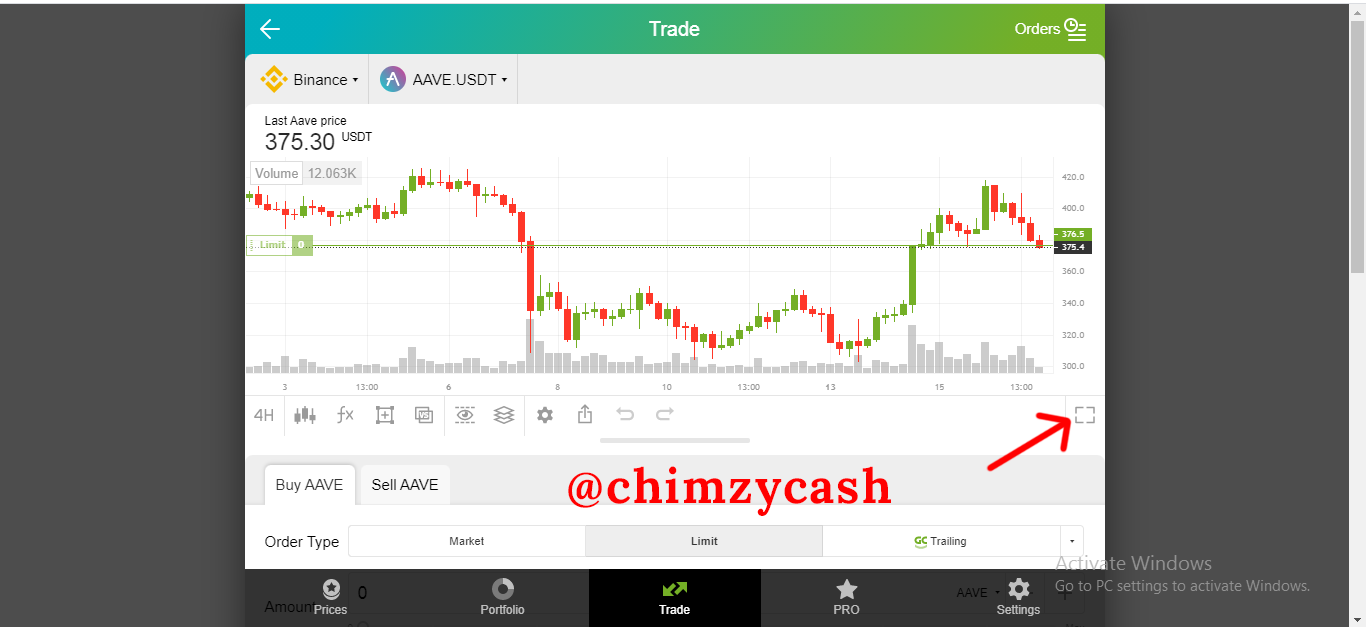
* Next is to go into fullscreen mode.
.png)
.png)
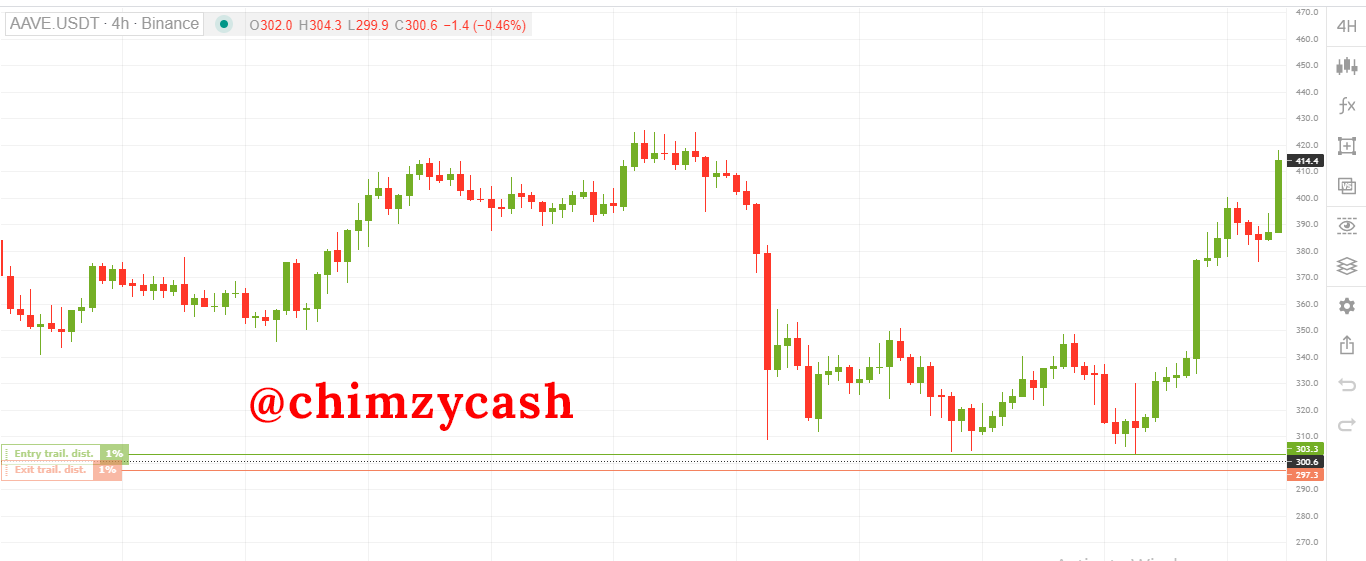
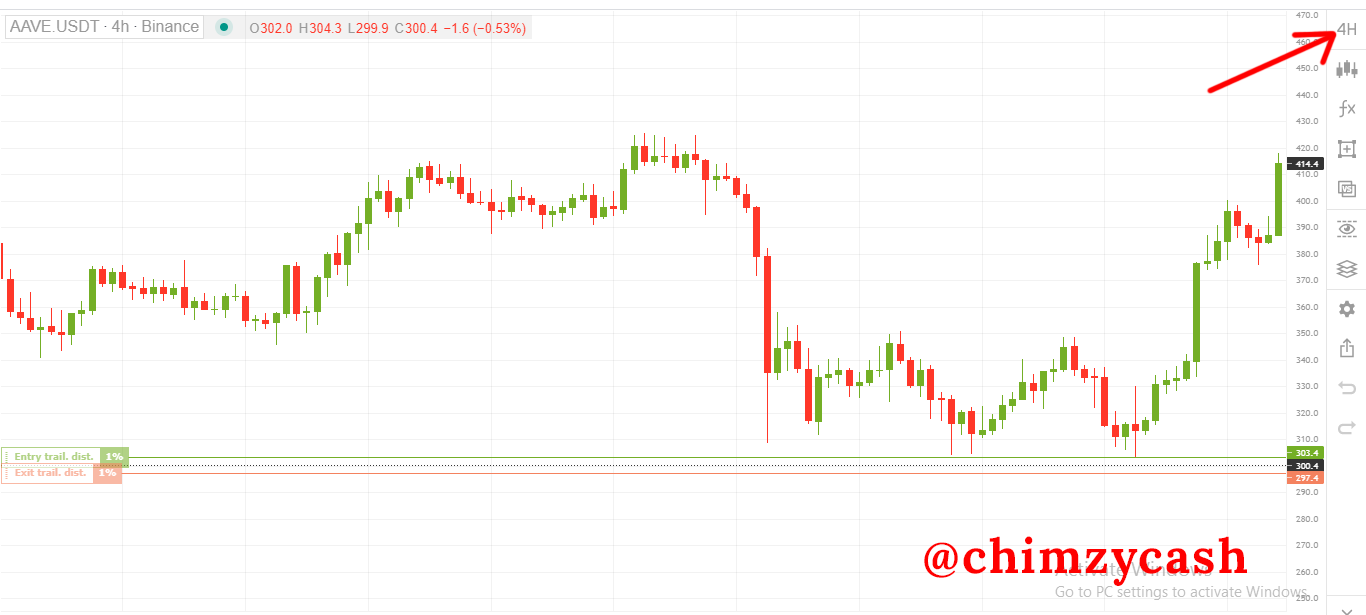
* To change the timeframe on the chart, click on the timeframe icon on the tabs section. I set the timeframe on the 4hr period
.png)
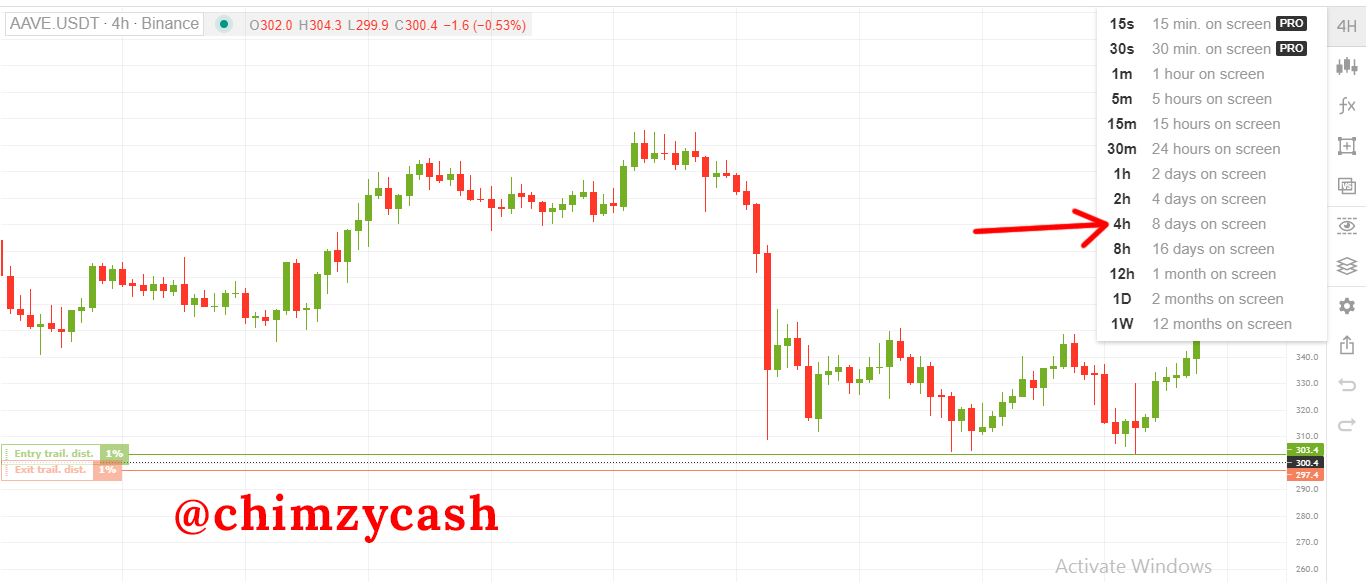.png)
.png)
* To add the CMF indicator, click on the indicators icon "fx".
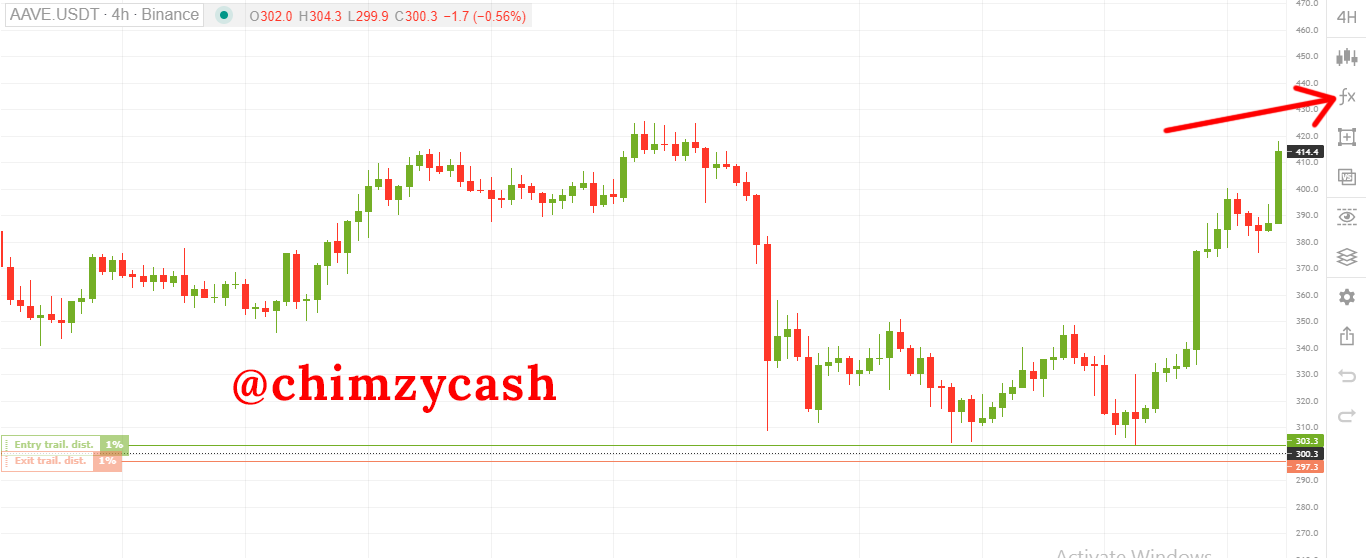.png)
* From the list of available options, select the CMF indicator to add it to the chart.
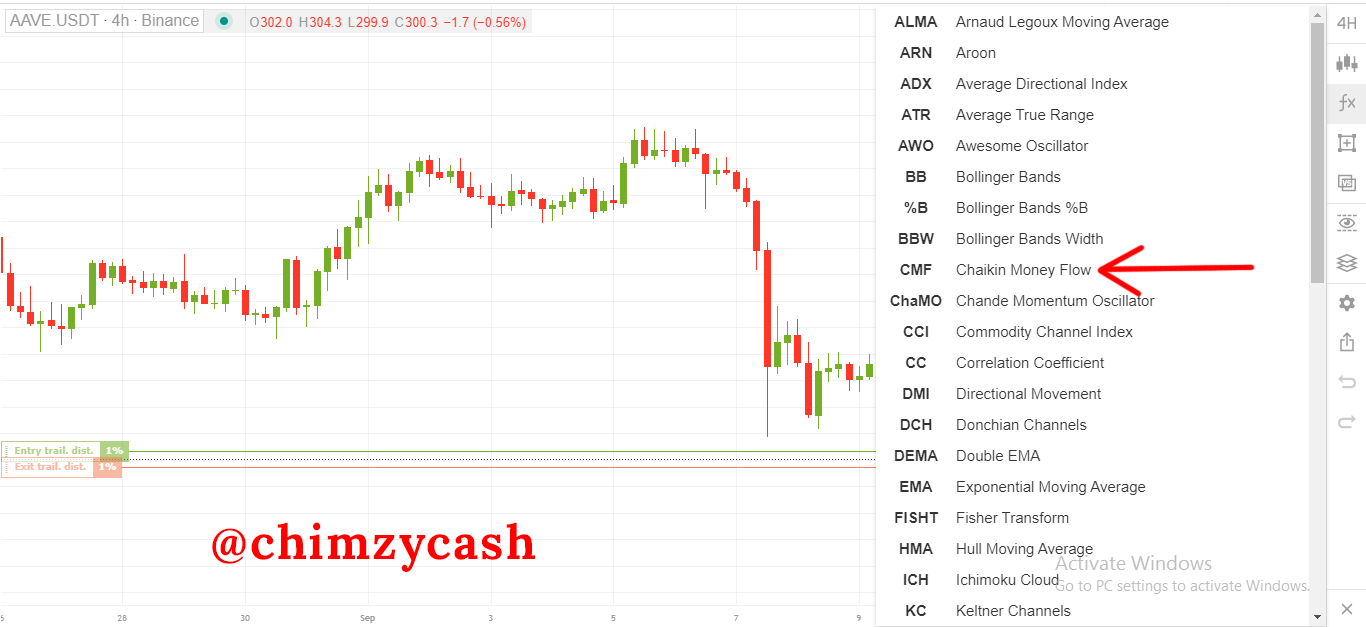.png)
* The CMF will be added.
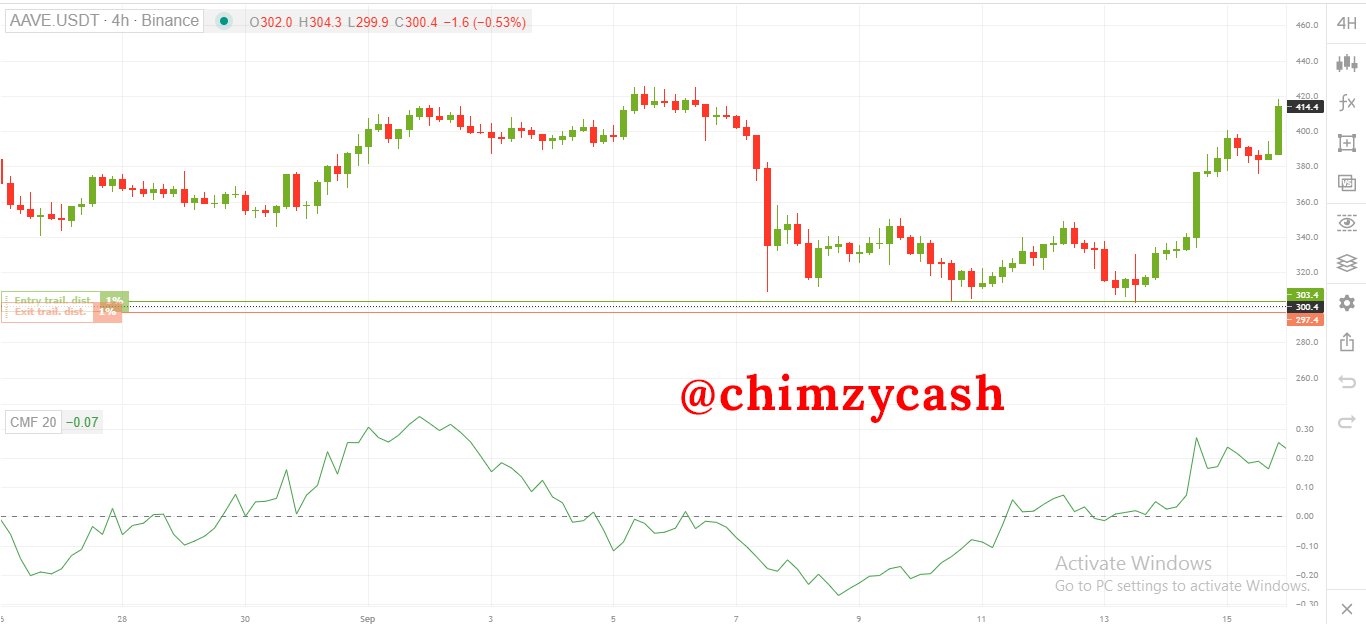.png)
* On the CMF indicator area, click on the 3 dots that for the menu.
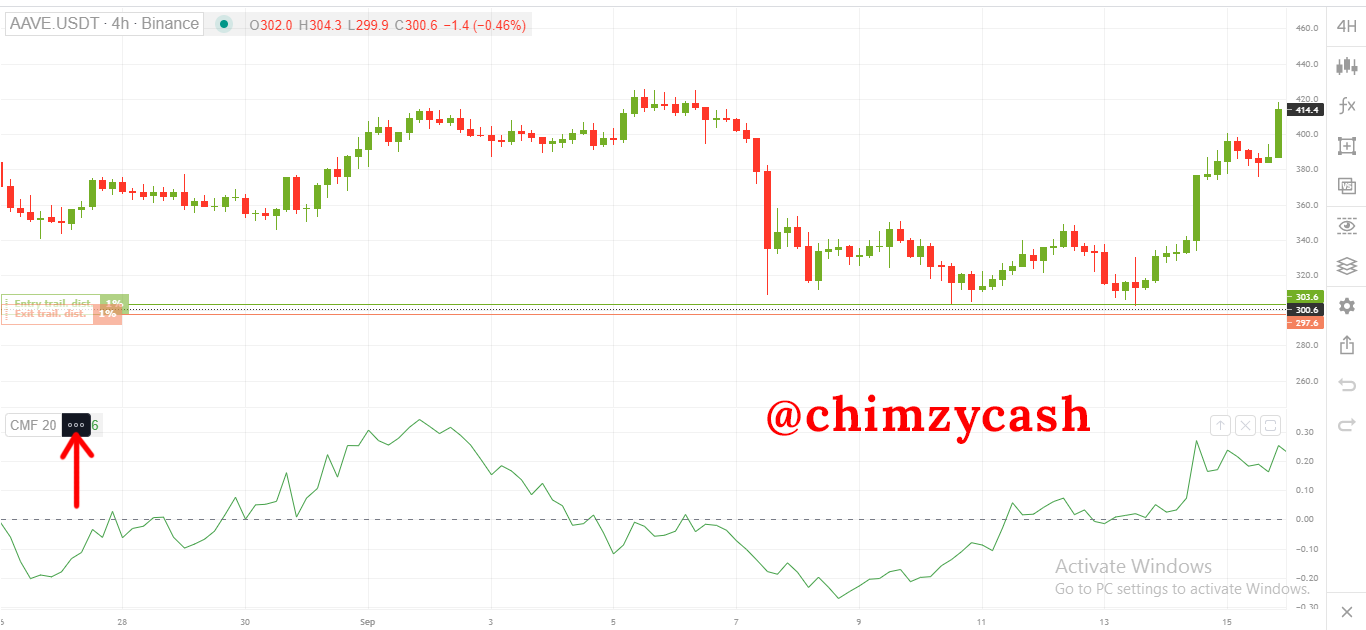.png)
* Click on settings to bring up the settings for the CMF indicator
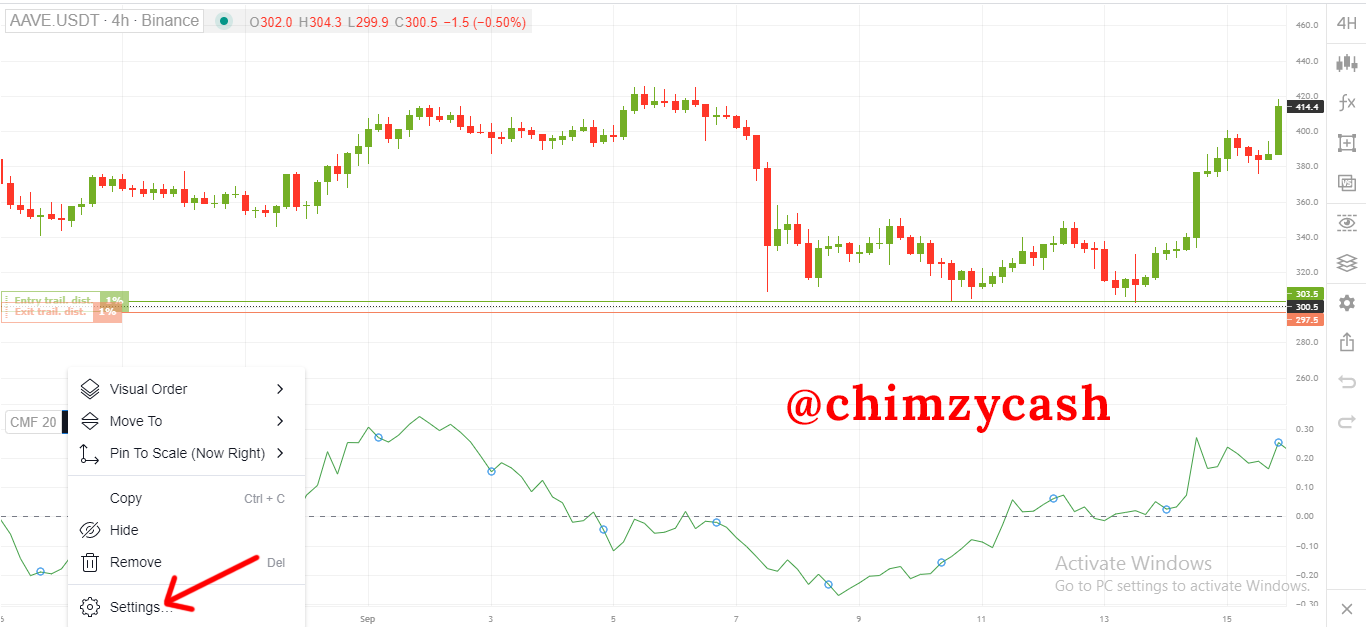.png)
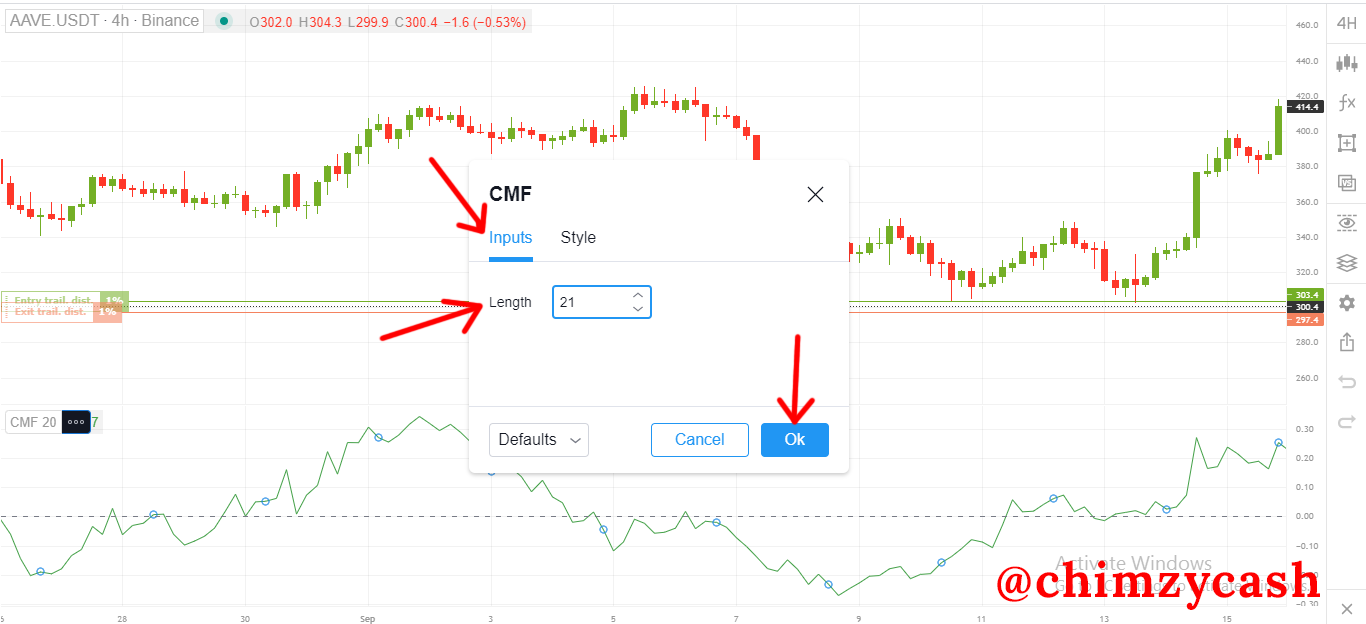
* The CMF indicator has 2 sections; the input and styles section.
* **Input** - On the input section, the period length is the only available parameter and can be changed to the desired period length.
.png)
* **Styles** - On the styles settings, the appearance such as line thickness, shape and color of the CMF oscillator line and the 0 center dotted line can be changed
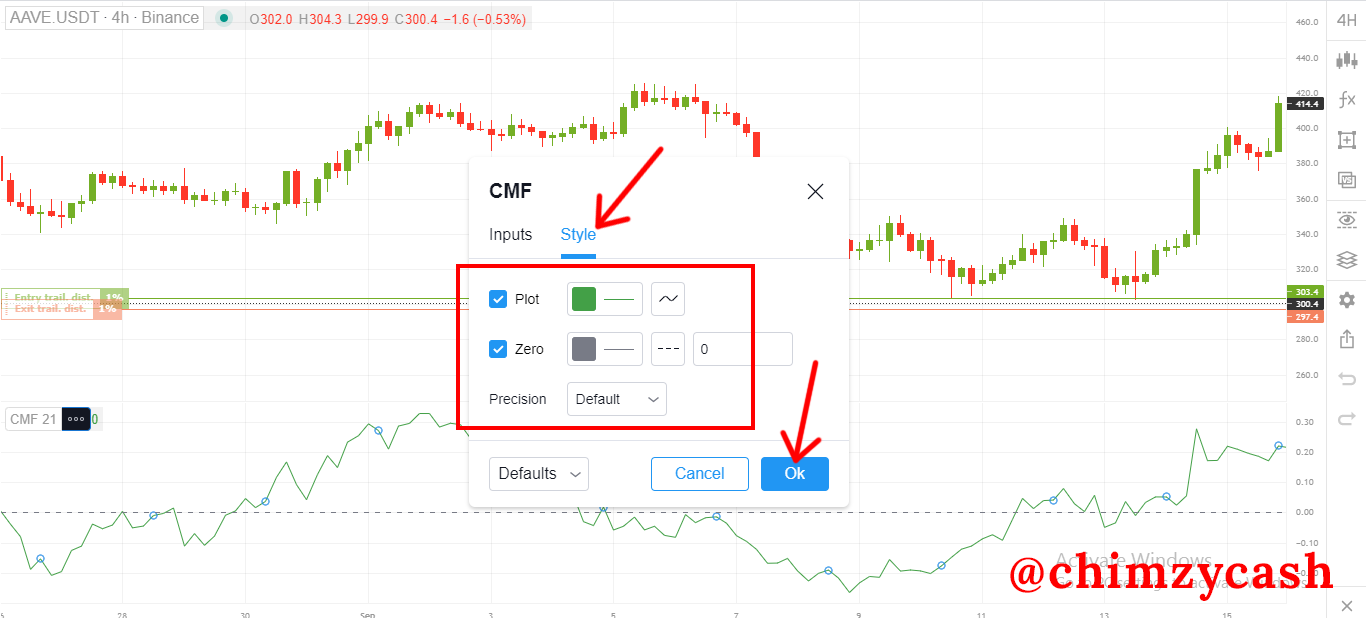.png)
#### Best settings
In my opinion, the best settings for the CMF indicator greatly depends on the particular time period for the analysis (short-term or long-term) and also the trading strategy. Even though the default settings on the CMF indicator is 21, the period length can be changed based on the particular time period. For short-term, short period length is more ideal. For long-term, a longer period length is more ideal.
<br>
## Question 3 - What is the indicator’s role in confirming the direction of trend and determining entry and exit points (buy/sell)
### Confirming Uptrend
The CMF is great for confirming the direction of a market trend. When the price is moving in an uptrend direction, the CMF indicator will indicate by the oscillator line also rising in an upward slope and moving above the 0 line. For the trend confirmation, the CMF oscillator line has to remain above the 0 line to confirm that the market is in an uptrend direction and the strength of the uptrend if the oscillator line continues to remain above the 0 line.
When the oscillator line is above 0 and remain above the 0 line, it basically means that there are more buyers in the market and the buying pressure is high which is causing the price to rise. This can be as a result of accumulation in the market. Looking at the BNB/USDT chart, we can see that as the market reversed into an uptrend, the CMF indicator indicated that as the oscillator line crossed above the 0 line and remained above the 0 line to confirm the uptrend.
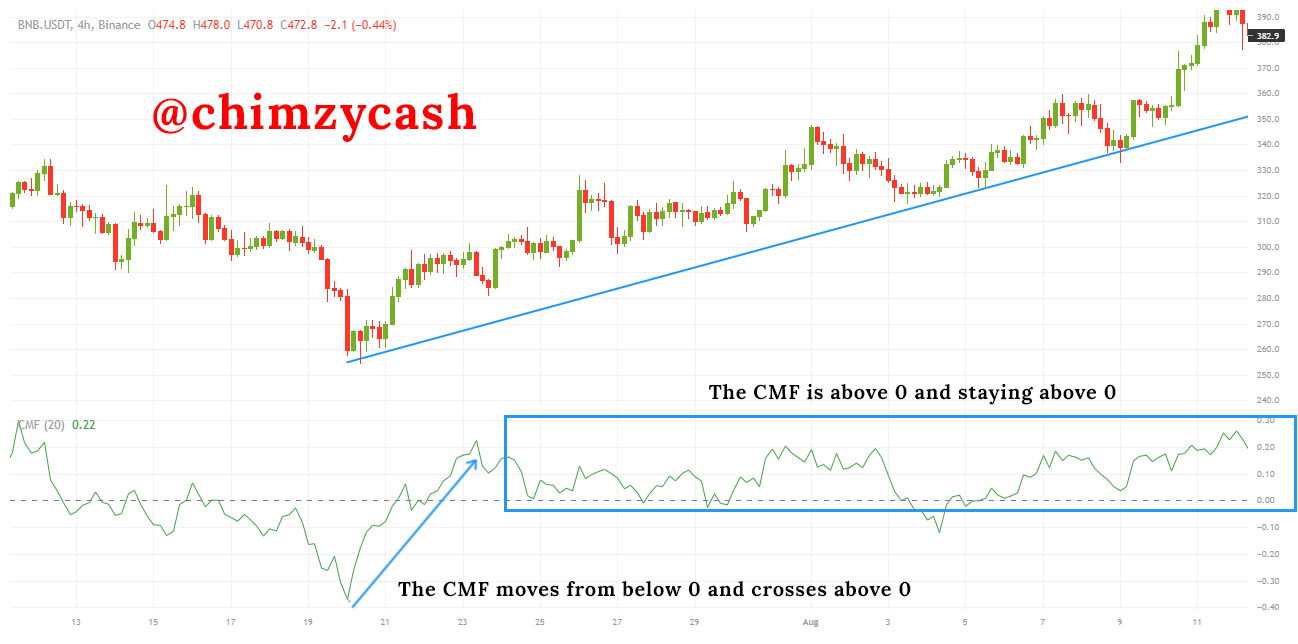
BNB/USDT Chart
### Confirming Downtrend
When the price is moving in a downtrend direction, the CMF indicator will indicate by the oscillator line also falling in a downward slope and moving below the 0 line. For the downtrend confirmation, the CMF oscillator line has to cross below the 0 line and remain below the 0 line to confirm that the market is truly in a downtrend and the strength of the downtrend becomes stronger if the oscillator line continues to remain below the 0 line.
When the oscillator line is below 0 and staying below the 0 line, it basically means that there are more sellers in the market and the selling pressure is high which is causing the price to fall. This can be as a result of distribution in the market. Looking at the AAVE/USDT chart, we can see that as the market reversed into a downtrend, the CMF indicator indicated the downtrend movement as the oscillator line crossed below the 0 line and remained below the 0 line to confirm the downtrend.
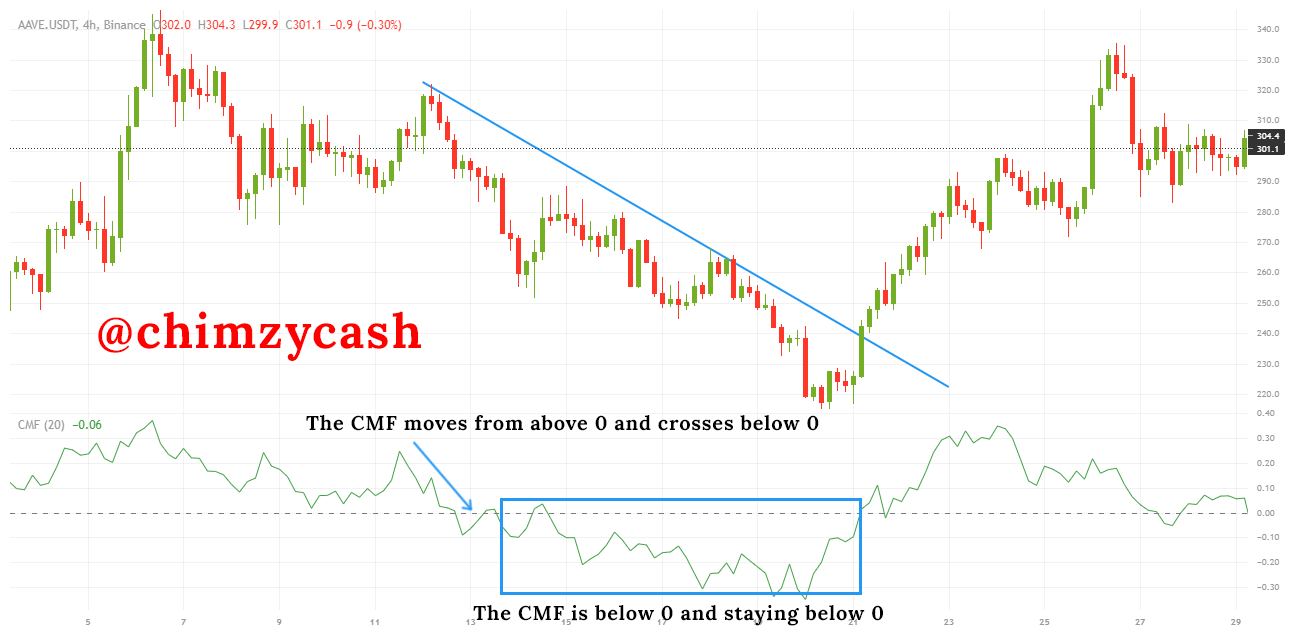
AAVE/USDT Chart
### Determining Buy and Sell points
The CMF indicator has proven to be a very powerful indicator that is great for signaling buy and sell points based on the movements of the CMF line, the value of the CMF and cross overs.
#### For Buy Entry and Exit
Before making a buy trade when using the CMF indicator, it is important to pay attention to the closing prices in relation to the highs. If the close prices are close to the highs of the session and the volume is increased, it means that the buying pressure have been high due to accumulation in the market. This accumulation in the market and the increased buying pressure causes the upward price movement. The CMF oscillator would reflect this move by having a positive reading above the 0 line.
When making a buy trade, I like to make use of +/- 0.1 crossover as a strategy for the buy. When the price is rising and the CMF oscillator line moves from below the negative 0.1 value and crosses above the positive 0.1 value, it is good signal for buy trade as there is a strong possibility that the price would continue in the upward direction.
For Buy Exit, when the CMF oscillator line already in the positive value moves from above the positive 0.1 value and approaches the negative 0.1 value, it is good exit signal as there is a strong possibility that the price could continue to move in the downward direction.
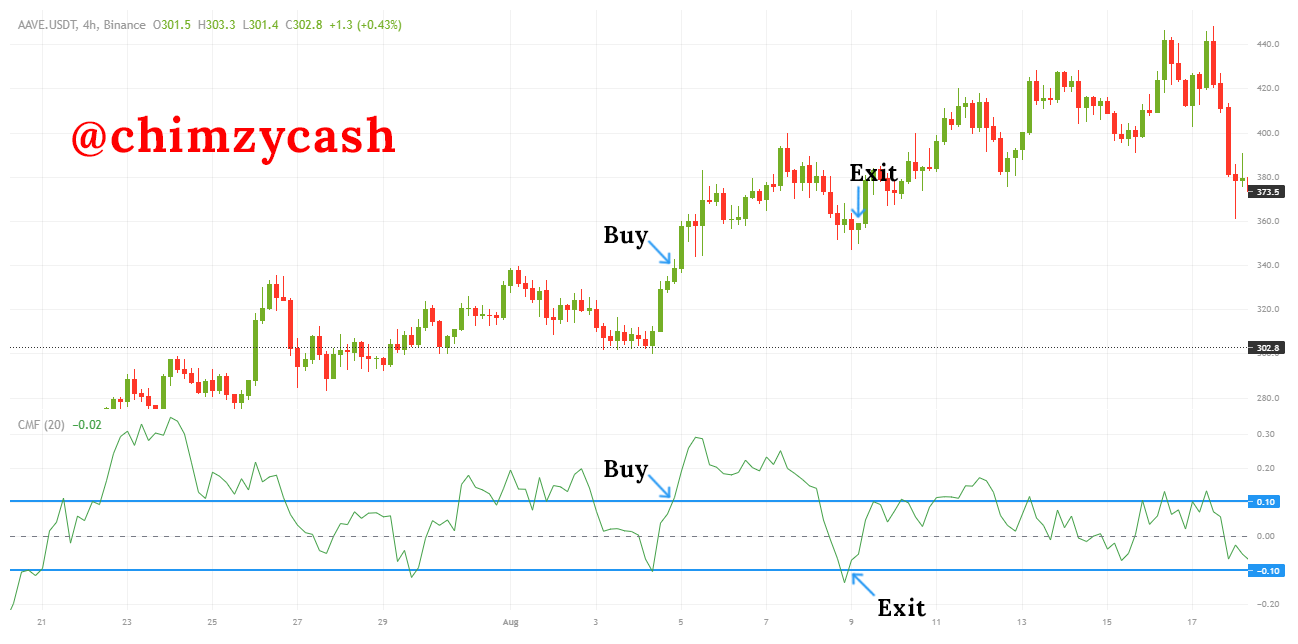
AAVE/USDT Chart
#### For Sell
Before making a sell trade when using the CMF indicator, it is important to pay attention to the closing prices in relation to the lows. If the close prices are close to the lows and the volume is decreased, it means that the selling pressure has been high due to distribution in the market. This distribution in the market and the increased selling pressure causes the downward price movement. The CMF oscillator would reflect this move by having a negative reading below the 0 line.
When making a sell trade, I also like to make use of +/- 0.1 crossover as a strategy for the sell trade. When the price is falling and the CMF oscillator line moves from above the positive 0.1 value and crosses below the negative 0.1 value, it is good signal for sell trade as there is a strong possibility that the price would continue in the downward direction.
For Sell Exit, when the CMF oscillator line already in the negative value, moves from below the negative 0.1 value and approaches the positive 0.1 value, it is good exit signal as there is a strong possibility that the price could continue to move in the upward direction.
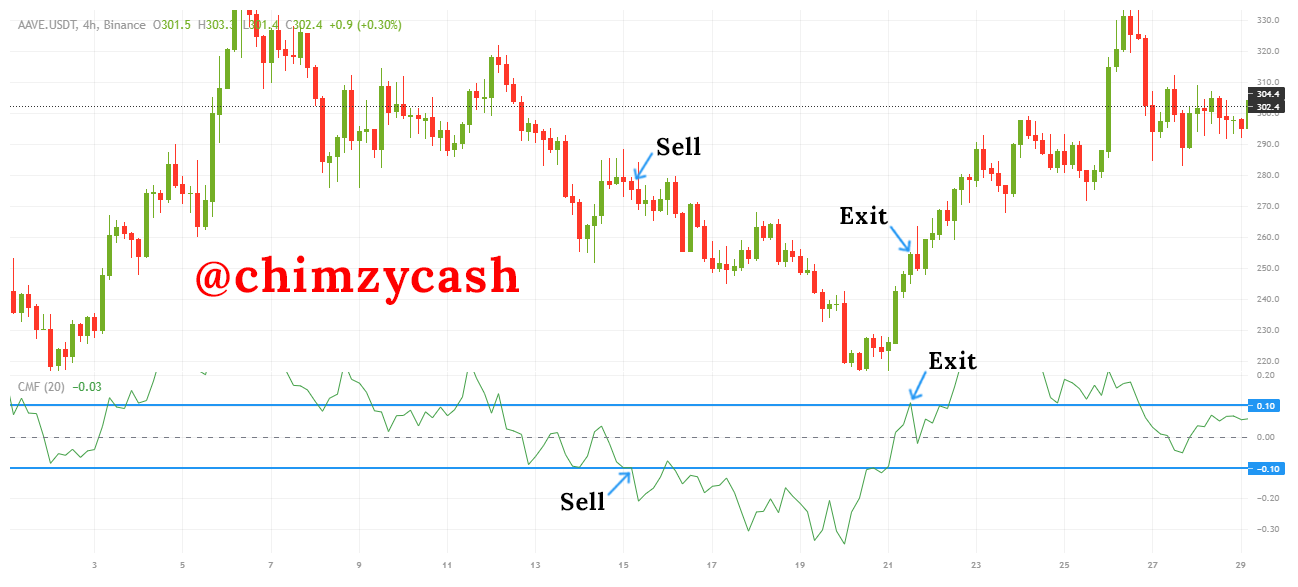
AAVE/USDT Chart
<br>
## Question 4 - Trade with a crossover signal between the CMF and wider lines such as +/- 0.1 or +/- 0.15 or it can also be +/- 0.2, identify the most important signals that can be extracted using several examples.
To trade with the crossover signal using the CMF indicator, I will be focusing on MATIC/USDT and BNB trading pairs.
### Buy signal – MATIC/USDT and BNB/USDT
Using the +/- 0.1 crossover strategy, when the price is rising and the CMF oscillator line moves from below the negative 0.1 value and crosses above the positive 0.1 value, it is good buy signal as there is a strong possibility that the price would continue in the upward direction. For the take profit and stoploss, I will be using the 2:1 risk/reward ratio.
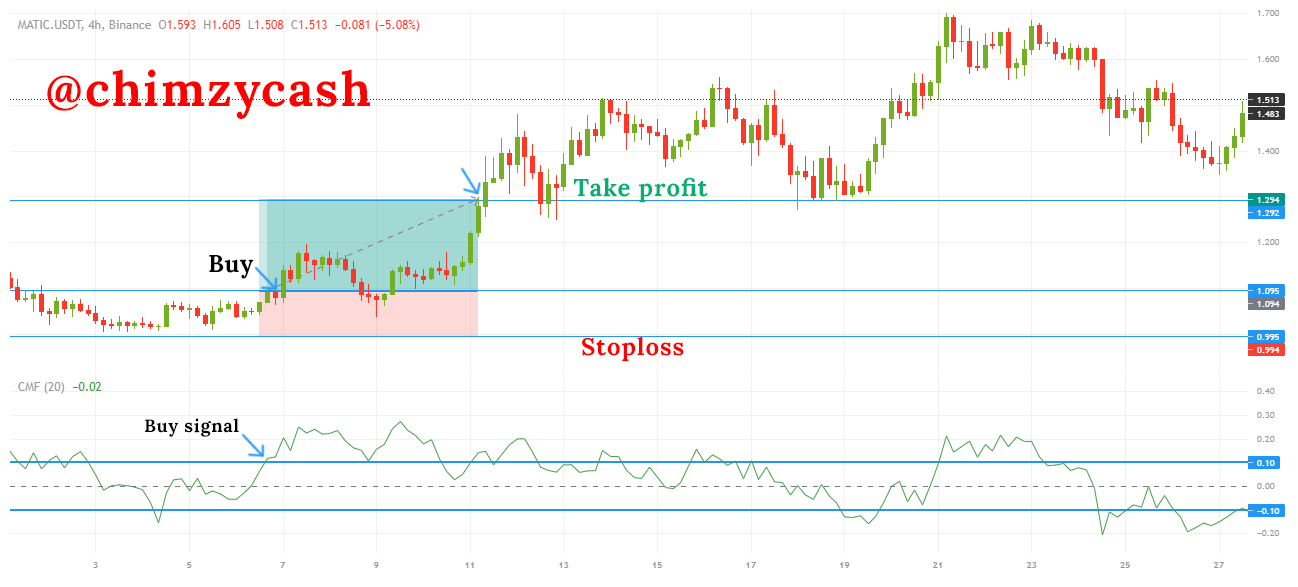
For MATIC/USDT, once the criteria was met, I placed a buy trade using a risk/reward ratio of 2:1. For the buy trade, my entry price was 1.095, using the risk/reward ratio of 2:1, I set my take profit level at 1.294 and stoploss at 0.994.
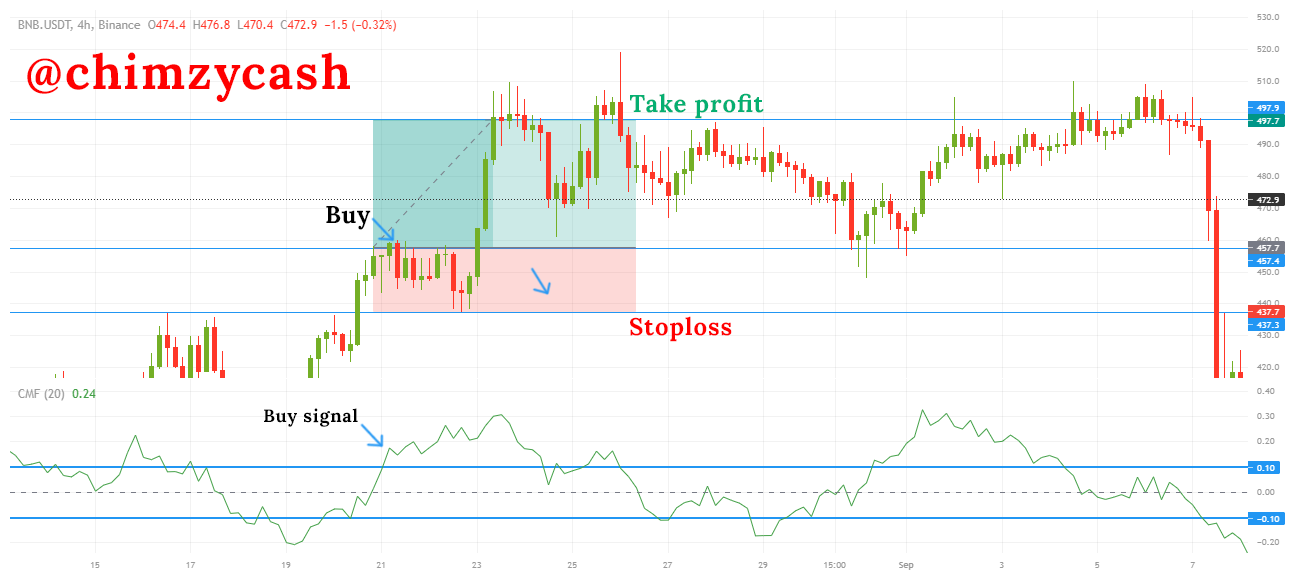
For BNB/USDT, once the criteria was met, I placed a buy trade using a risk/reward ratio of 2:1. For the buy trade, my entry price was 457.7, using the risk/reward ratio of 2:1, I set my take profit level at 497.9 and stoploss at 437.3.
### Sell signal – MATIC/USDT and BNB/USDT
Using the +/- 0.1 crossover strategy, when the price is falling and the CMF oscillator line moves from above the positive 0.1 value and crosses below the positive 0.1 value, it is good sell signal as there is a strong possibility that the price would continue in the downward direction.
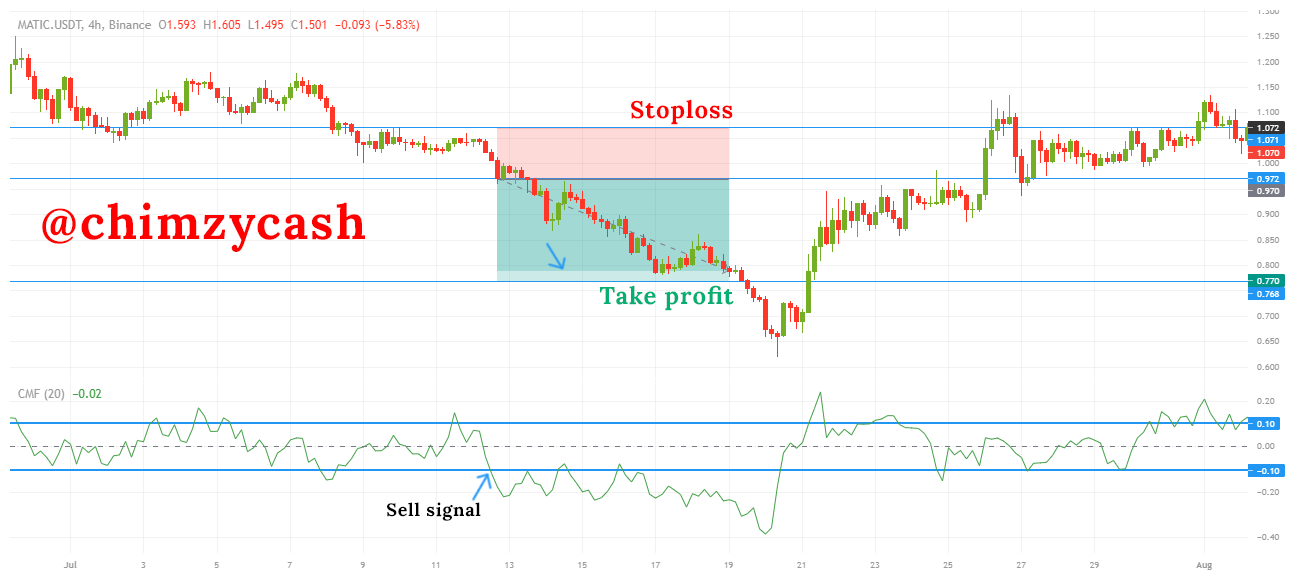
For MATIC/USDT, once the sell signal criteria was met, I placed a sell trade using a risk/reward ratio of 2:1. For the sell trade, my entry price was 0.972, using the risk/reward ratio of 2:1, I set my take profit level at 0.770 and stoploss at 1.072.
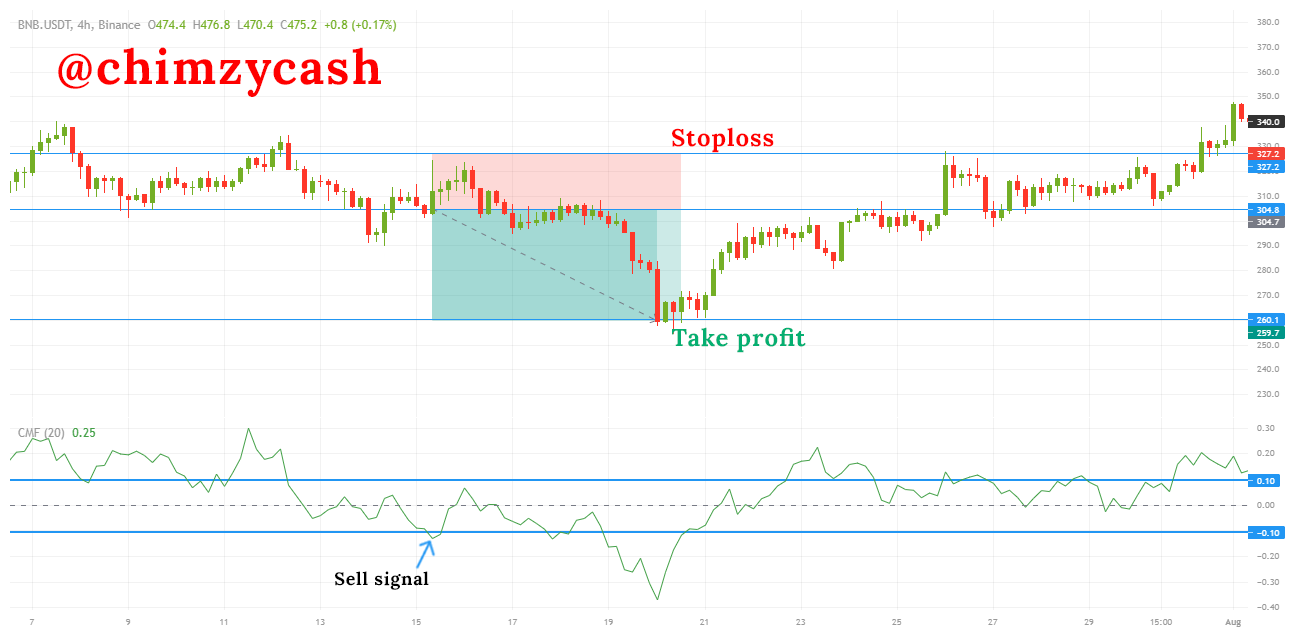
For BNB/USDT, once the sell signal criteria was met, I placed a sell trade using a risk/reward ratio of 2:1. For the sell trade, my entry price was 304.8, using the risk/reward ratio of 2:1, I set my take profit level at 260.1 and stoploss at 327.7.
<br>
## Question 5 - How to trade with divergence between the CMF and the price line? Does this trading strategy produce false signals?
When using the CMF indicator, the bullish divergence and bearish divergence is very useful and can provide a very valuable trade signals. When it comes to divergences between CMF and price action, it is basically when the CMF and price are moving in opposite direction. This simply means that when the price is moving in one direction and the CMF oscillator is moving in another direction, the bullish or bearish divergence occurs. This divergence can be used as an early signal of a potential trend reversal coming.
### Bullish Divergence on CMF
A bullish divergence on the CMF occurs when the price if falling in a downward direction but at the same time the CMF is moving in an upward slope direction. This is an indication that there is a bullish divergence in the market. The bullish divergence on the CMF is an indication that the downward price movement is weak and that there is a slowdown in the downtrend momentum. When the bullish divergence occurs on the CMF, it is a strong indication that the momentum of the buyers is still strong even though the price of the asset has decreased, that buying pressure in the market is high and buyers are now in control of the market.
The Bullish divergence on the CMF can be used as a valuable early signal for a potential upcoming reversal in the market which serves as a good buy entry signal. From the AAVE/USDT chart, we can see the bullish divergence. As price was falling, the CMF was rising in an upward slope, this was a signal of a potential reversal in the market. We can see that after that, the price reversed into a downward movement or downtrend.
.png)
AAVE/USDT Chart
### Bearish Divergence on CMF
A bearish divergence on the CMF occurs when the price if rising in an upward direction but at the same time the CMF is moving in a downward slope direction. This is an indication that there is a bearish divergence in the market. The bearish divergence on the CMF is an indication that the upward price movement is weak and that there is a slowdown in the uptrend momentum. When the bearish divergence occurs on the CMF, it is a strong indication that the momentum of the sellers is still strong even though the price of the asset has increased, the selling pressure in the market is high and sellers are now in control of the market.
The Bearish divergence on the CMF can be used as a valuable early signal for a potential upcoming reversal in the market which serves as a good sell entry signal. From the AAVE/USDT chart, we can see the bearish divergence. As price was rising, the CMF was falling in an upward slope, this was a signal of a potential reversal in the market. We can see that after that, the price reversed into an upward movement or uptrend.
.png)
AAVE/USDT Chart
### False Signals on CMF indicator
Yes, the CMF indicator is known to produce false signals. As a volume-based indicator, it is not always reliable and can produce false signals. As always, no single indicator is perfect, which means that there is always limitations and false signals. That is why before taking any buy or sell signal from the CMF indicator, it is important to combine the CMF indicator with other technical indicators or tools like the moving average indicator, RSI, MACD, ichimoku cloud, for signal confirmation and to identify false signals before making any trading decision.
## 6 - Conclusion
The CMF indicator has proven to be a very powerful indicator for identifying trends in the market. This can become very valuable for trader to identify useful signals when it comes to confirming trends in the market, early trend reversal signals and also for good buy and sell signals. However, as a volume-based indicator, the CMF indicator is not always reliable and can produce false signals. That is why before making use of the signals on the CMF, it is very important to combine the CMF indicator with other technical indicators and tools to confirm the signals before making any trading decisions. The CMF indicator is one of the popular indicators and has proven to be a very powerful indicator utilized by traders spot trading opportunities in the market in order to make profits.
</div>
@kouba01