<br>I do apologize for the late delivery of the market report for the day. As I trade for a living I have been moving positions around, adding too, subtracting etc. this a.m. and watching the turn on the 1 hour to see what happens.
So what is going on with BTC today? Well there is still no clear answer as to whether price action is more indicative of a bullish triangle or a bearish flag and the only way we will have an answer is to see what occurs in the $16,000 range. While it may sound counterintuitive to say that the only way we will know if things are bad is to go up, that is just typically how these things play out. To that end, and I do not fancy giving predictions as people play the blame game when the blindly follow advice, we are more than likely going up past $15,000 as both longer term patterns (bullish triangle, and bearish flag) need it to develop. Do keep in mind however, that this is crypto and things could go south in a moment invalidating either or both of these possible scenarios; play the market accordingly.
So let’s get to it.
The 12 hour chart
I have kept the lines from yesterday in regards to a bullish triangle and it appears as though the bottom held support and we slid in around $12,900 as I said yesterday when discussing the 2 hour time frame.
> “While there are some bullish indicators, the 7 has not crossed the 21 and is just as likely to get rejected back down for a lower low at $14,500 which would put us at $13,200 or $12,900 sometime in the early A.M. of 1/11.”
The RSI also attempted a straight bounce from the bottom after too short a period in oversold territory. Accordingly it folded at .35 on my charts or $14,900 and we had a mini crash last night. This was mentioned yesterday
>”The RSI has not been in oversold territory as long as it usually is for this time period and seems to be attempting a straight bounce from the bottom. These usually fold midway up in the .38-.65 range before heading back down.”
Looking at this time period objectively, the MACD histogram again shows that this selling period may be coming to an end and we are still in oversold territory. We have broken below MACD 0 (Bearish) and we may still suffer some more ill effects from the 7/77 downwards cross that occurred at $15,142 on Jan 9th. This would likely manifest as another shake out and retest of the triangle bottom around $13,000 sometime tonight or tomorrow. From there or from now in the event that it does not happen expect a slow craw upwards along it as buyers and sellers figure out what they want to do. Included is a projected timeline for pattern top, DO NOT TAKE THIS AS GOSPEL (These are my notes nothing more and may just as likely be wrong).
The 6 hour is not really providing me much positive to work with except attempting to lure me into a FOMO situation by trying to anticipate what has not occurred in the hopes of beating the market. According to the MACD histogram this selling period “may” be coming to an end although we have no confirmation of fact and it is just as likely to reverse and test the lower boundaries of the triangle again. I think we may have shaken off the affects of the 7/77 downwards cross that occurred at $14,400 around 7 a.m. on 1/10; a cross that cost us 11 percent. Hopefully now you see the influence that these averages in this time frame have. More than likely we are looking at another test of the lower boundaries of the triangle and hopefully not a break through.
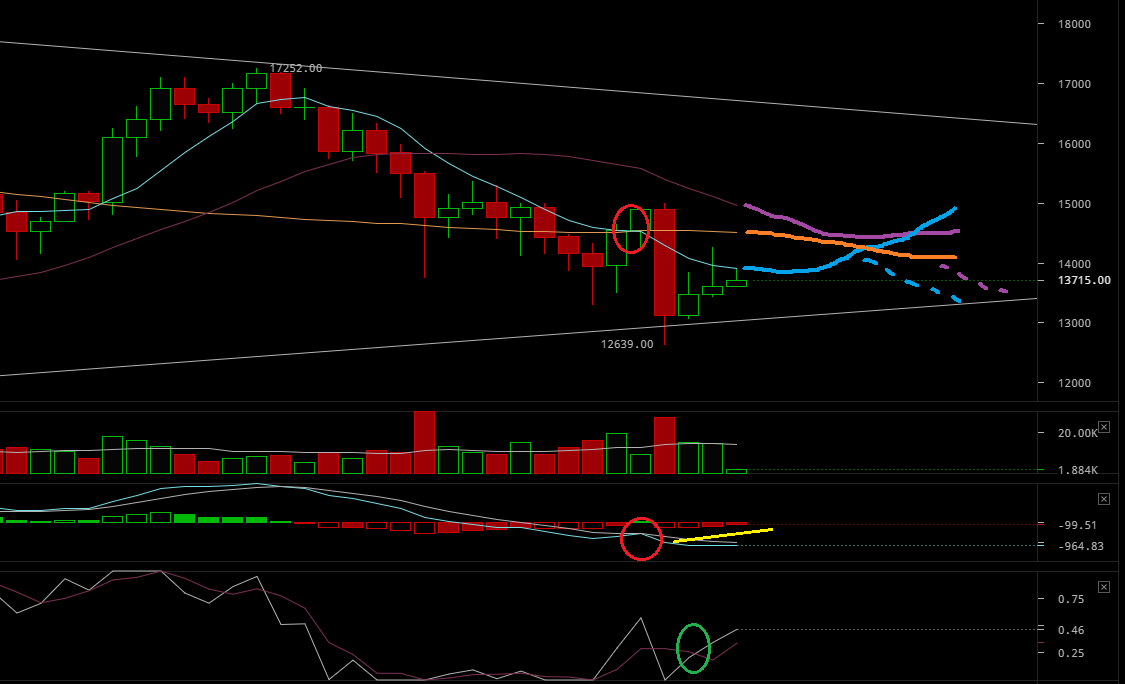
Just a closer image of the six.
Negative MACD/Signal line crossover, potential selling frame coming to an end, below MACD 0, possible positive RSI cross from oversold territory. Nothing that inclines me to buy at the moment.

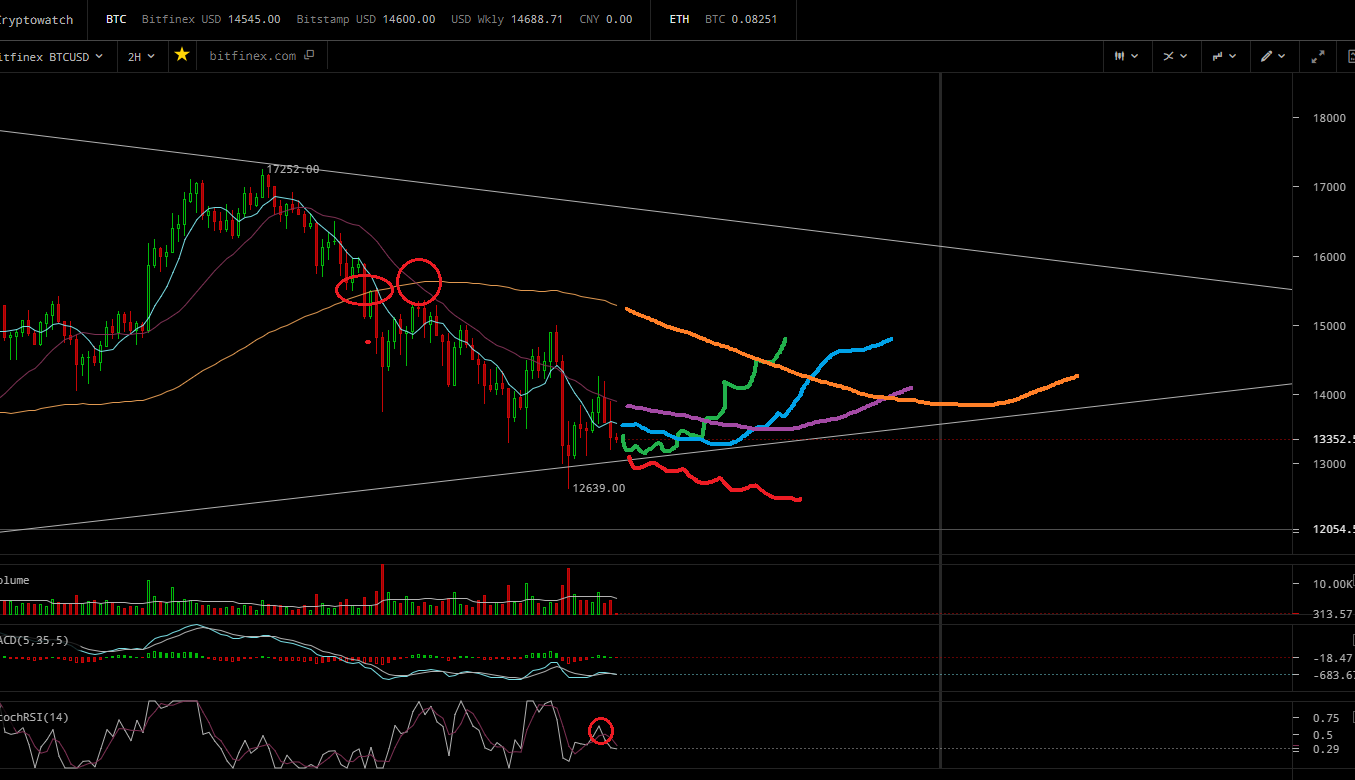
I’m not feeling the love on the 4 hour chart either, the 21 broke below the 77 and that should provide plenty of momentum for a retest of the lower boundaries and the $12,900 or lower zone. I have nill in the form of buying confirmation save we have been in oversold territory for enough time to expect an upswing. The selling period almost closed out at 7 this morning and now we have another follow on selling period according the MACD histogram. On the positive side, these are not usually as severe as the period that proceeds them providing the previous period occurred on higher than average volume. Possible trend lines included.
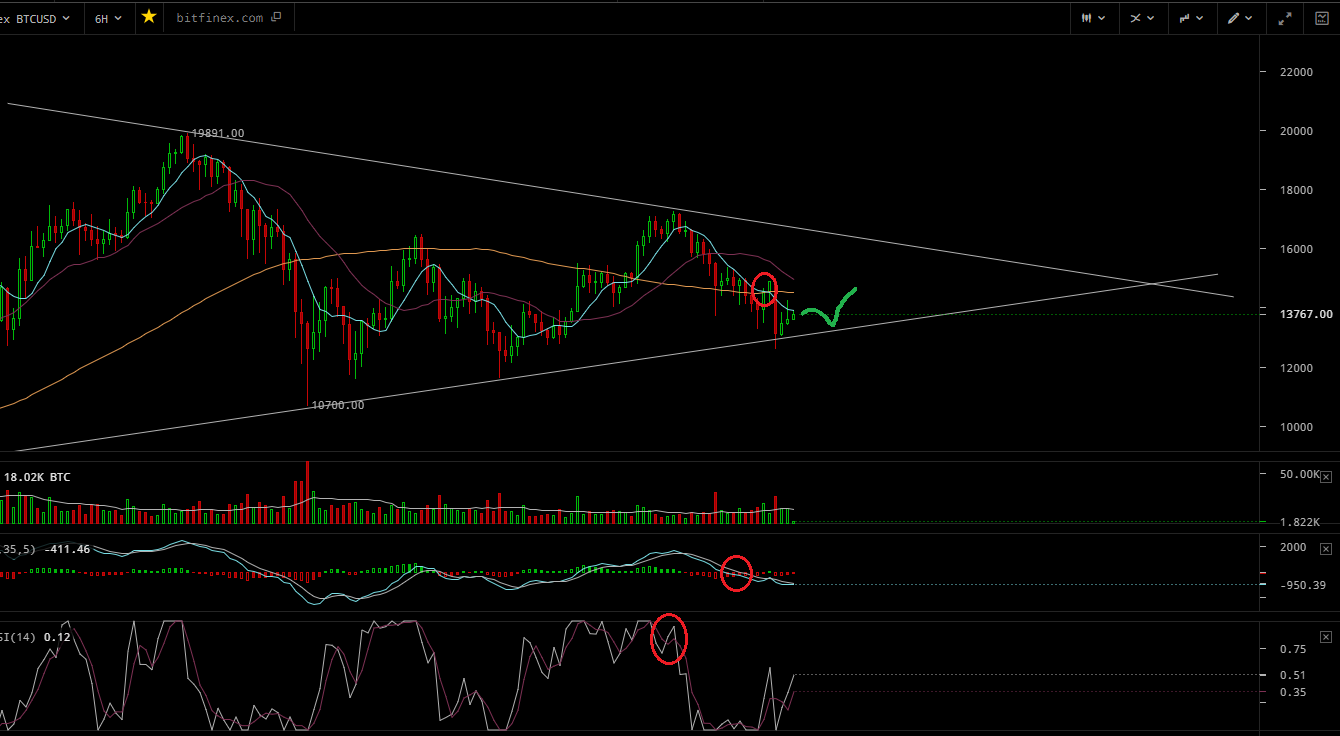
Nothing particularly motivating on the 2 hour either, save that we are beginning to run out of room in regards to the bottom of the triangle in the event it is a bullish scenario. Whether price will break up or break down remains to be seen though the battle of $13,000 will be an important one. We are below MACD 0 line, we have a bearish MACD/Signal line cross. Price has consistently been unable to break the midlevel 21 period trend line and a retest of the bottom is more than likely at this point. A consistent hold above $13,600-$13,800 will be key price points to break resistance in this time !frame. Possible trend lines are included but it is a bit early to tell for sure which direction we are going and again is like trying to forecast a hurricane while it is still deep into the Atlantic.
[1.png](https://steemitimages.com/DQmQM2npEmSjaXyL7P42kywcWrgSxKAYgP9jvJxhdkLSYhQ/1.png)
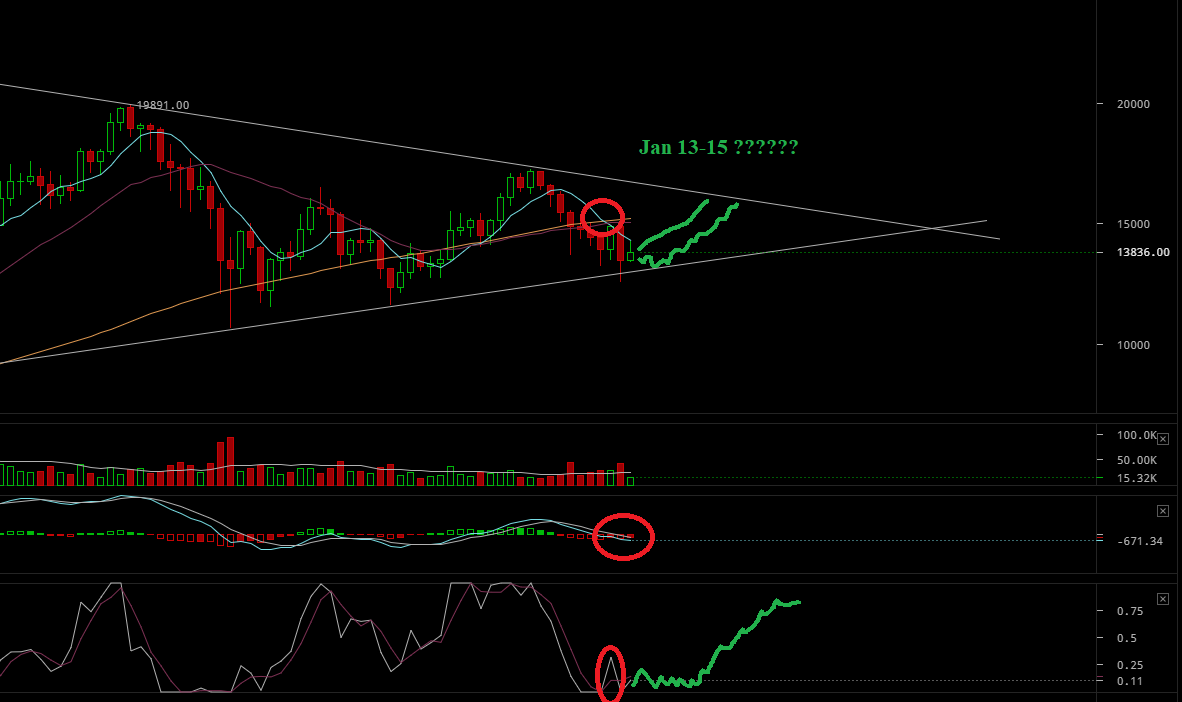
Into the 1 hour. Again I do not use the 1 hour to make buying and selling decisions, just a point of reference for the larger time frames. There is not really a lot of information from this time frame that can be used to predict the larger time frames. We have 2 sell indicators, an RSI cross and an MACD/Signal line cross. The 7 and 21 are basically intertwined at the moment with 7 riding just above the 21 with nearly indistinguishable separation. Taking a WAG (Wild Ass Guess) at current trajectory the 77 and the bottom of the potential bullish triangle will intersect sometime around noon on January 13th if we do not pull the nose up.
That said something interesting is going to happen over the next 48 hours, in the event that we hold the $13,000 and price continues to squeeze between the longer term average and the support line at the bottom expect a sharp break upwards. That said we have little confirmation in the form of moving average support and we are just as likely to break below $13,000 at the moment. That said, having done this for some time, I am feeling a bit of selling exhaustion at the moment, but you can’t trade on feelings.

The 15, DO NOT MAKE ANY DECISIONS BASED UPON THIS FRAME, ITS TO SHORT AND ITS JUST DUMB TO DO SO. That said I have included it to illustrate that we are getting close to a turning point either up or down at the moving averages are beginning to squeeze price between the lower level of support (possible bullish triangle) the averages will either pile drive price below support in which case we go down quickly or will squeeze it lower and lower until it pops to the surface and above the 77 in rapid fashion, hopefully igniting a bit of bullish fire in the larger time frames. Timing this frame we run out of room by noon tomorrow and may have an indication of which way things are going to go.
DO NOT PLAY THESE SHORTER TIME FRAMES FOR DECISION MAKING IN REGARDS TO BUYING AND SELLING. THESE TIME FRAMES ARE THE ONES THAT HURT THE INEXPERIENCED AND GET THEM WHIPSAWED AROUND BUYING TOPS, BUYING FALSE BOTTOMS, PANIC SELLING ETC. IN THE GRAND SCHEME OF THINGS THEY MEAN NOTHING, BUT YOU CAN USE THEM TO POTENTIALLY FORECAST THE ACTIONS OF LARGER TIME FRAMES THAT WILL COUNT WHEN IT COMES TIME TO BUY. I CONSIDER THESE SMALLER FRAMES TO BE HEADS UP FRAMES AND CAN ALERT ME OF MICRO CONFIRMATIONS OF MY HYPOTHESIS ON LARGER FRAMES. I ALSO USE THEM TO GIVE ME AN APPROXIMATE IDEA OF TIMING ON LARGER TIME FRAMES, WHEN I NEED TO BE LOOKING AT THE COMPUTER ETC. I DO NOT BUY AND SELL WITH THESE TIME FRAMES.
FYI. BCH 3 Day Histogram has gone green.. do your own research. When in doubt draw lines..
Also the charts and diagrams come from here: https://cryptowat.ch/bitfinex/btcusd/2h
I use these as they are free and you can use them to match my setting or create your own.
My Previous Analysis:
https://steemit.com/bitcoin/@pawsdog/1-10-2017-the-market-view-and-trading-outlook
https://steemit.com/bitcoin/@pawsdog/1-9-2017-the-market-view-and-trading-outlook
https://steemit.com/bitcoin/@pawsdog/1-8-2017-the-market-view-and-trading-outlook
https://steemit.com/bitcoin/@pawsdog/1-5-2017-the-market-view-and-trading-outlook
https://steemit.com/bitcoin/@pawsdog/1-4-2017-the-market-view-and-trading-outlook
https://steemit.com/bitcoin/@pawsdog/1-3-2017-the-market-view-and-trading-outlook
https://steemit.com/bitcoin/@pawsdog/1-2-2017-the-market-view-and-trading-outlook
https://steemit.com/bitcoin/@pawsdog/1-1-2017-the-market-view-and-trading-outlook
https://steemit.com/bitcoin/@pawsdog/12-31-2017-the-market-view-and-trading-outlook
***********************************************************
<p><center>
<a href="https://steemit.com/life/@pawsdog/hello-steemit-creative-talented-writer-and-trade-analyst-entering-the-community-r1">Who Am I? STEEMIT INTRODUCTION </a></center>
</p>
***********************************************************
<p><center><a href="http://steemit.com/@pawsdog"><img src="https://steemitimages.com/DQmSgvWb7SsQm8TMfvUiyEsbfd7sH3M5YZZa7QRsqV2Q5vk/DQmSgvWb7SsQm8TMfvUiyEsbfd7sH3M5YZZa7QRsqV2Q5vk.gif"/></a></center></p>