.png)
<div class="text-justify">
Hello mates, all too soon this is the 7th week in the 4th season of Crypto Academy and I believe it has been as good as i has ever been. This is my submission for @imagen homework on the Introduction to the principles of crypto analysis.
-------
>What are the differences between Fundamental Analysis and Technical Analysis? Which one is used most often?
-------
In attempt to understand price behavior and movement of assets to make accurate predictions and informed investment and trading decisions, traders do some sort of analysis be it Fundamental or Technical. Though they both help to predict future price movements and behavior, they have some differences.
**Fundamental Analysis**
Before the introduction of cryptocurrencies, traders do some sort of Fundamental analysis to their assets (stocks) before trading. But today, we can employ fundamental analysis to crypto trading. Fundamental analysis is simply evaluating or assessing an asset using its intrinsic value. With fundamental analysis, traders examine the economic and financial details about the asset to inform their trading decisions.
Fundamental analysis basically looks at studying an asset thoroughly (considering a number of issues like the goal of the project, the team behind the project, real-life application or use of the project among others), and then compare the current market value of the asset to its intrinsic value and see if the asset is currently undervalued or overvalued. With this information, traders can make very informed trading and investment decisions.
Under fundamental analysis, there are about 3 sub-analysis traders can perform: *Project analysis*, which is concerned with identifying the project, its goals, developers, the whitepaper etc.; *Financial metrics analysis*, which looks at the market cap of the asset, total, maximum and circulating supply, the asset's liquidity etc.; and *On-chain metric analysis*, which focuses on what is happening on the blockchain such as, number of transactions carried out hash rates etc.
**Technical analysis**
Technical analysis is used to forecast the price of an asset on the principle that, the price of an asset is determined by the interaction of demand and supply factors in the market. With Technical analysis, traders can predict the asset's future market price based on the stock's previous performance statistics.
Technical analysis is usually done with studying charts, looking out for trends in the chart, employing indicators to understand and predict the price behavior of an asset. When trading cryptocurrencies for instance, you realize they are very volatile that is price fluctuates easily, an asset can be seen trending upwards and in the next hour, days or weeks it is in a very bearish trend. This fluctuations and volatility of crypto assets presents trading opportunities for traders and with Technical analysis, traders can ascertain important points in the chart that helps identify these trading opportunities.
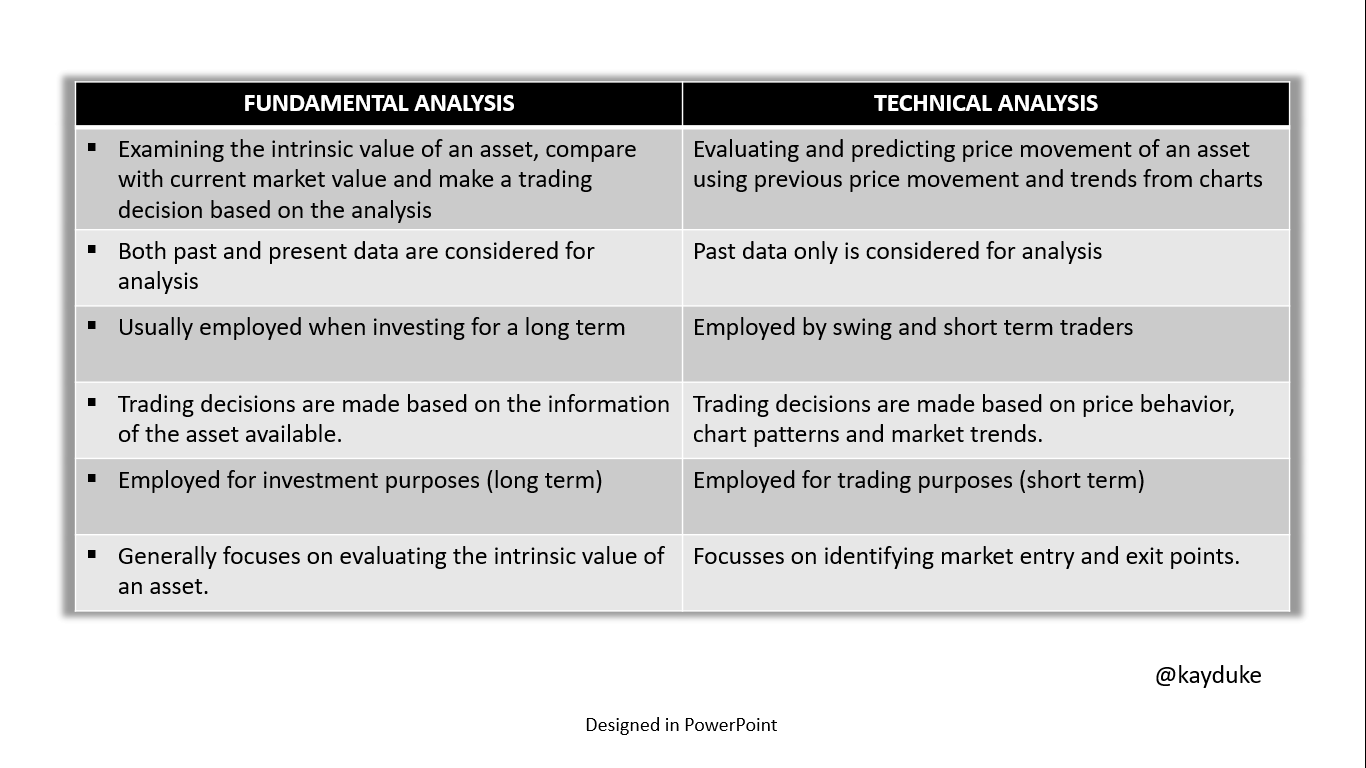
Below is a summary of the key differences between Fundamental Analysis and Technical Analysis.
.png)

-------
>Choose one of the following crypto assets and perform a Fundamental Analysis indicating the objective of the Project, Financial Metrics, and On-Chain Metrics. Cardano (ADA) Solana (SOL) Terra (MOON) Chiliz (CHZ) Polkadot (DOT)
-------
<center>**Polkadot (DOT)**</center>
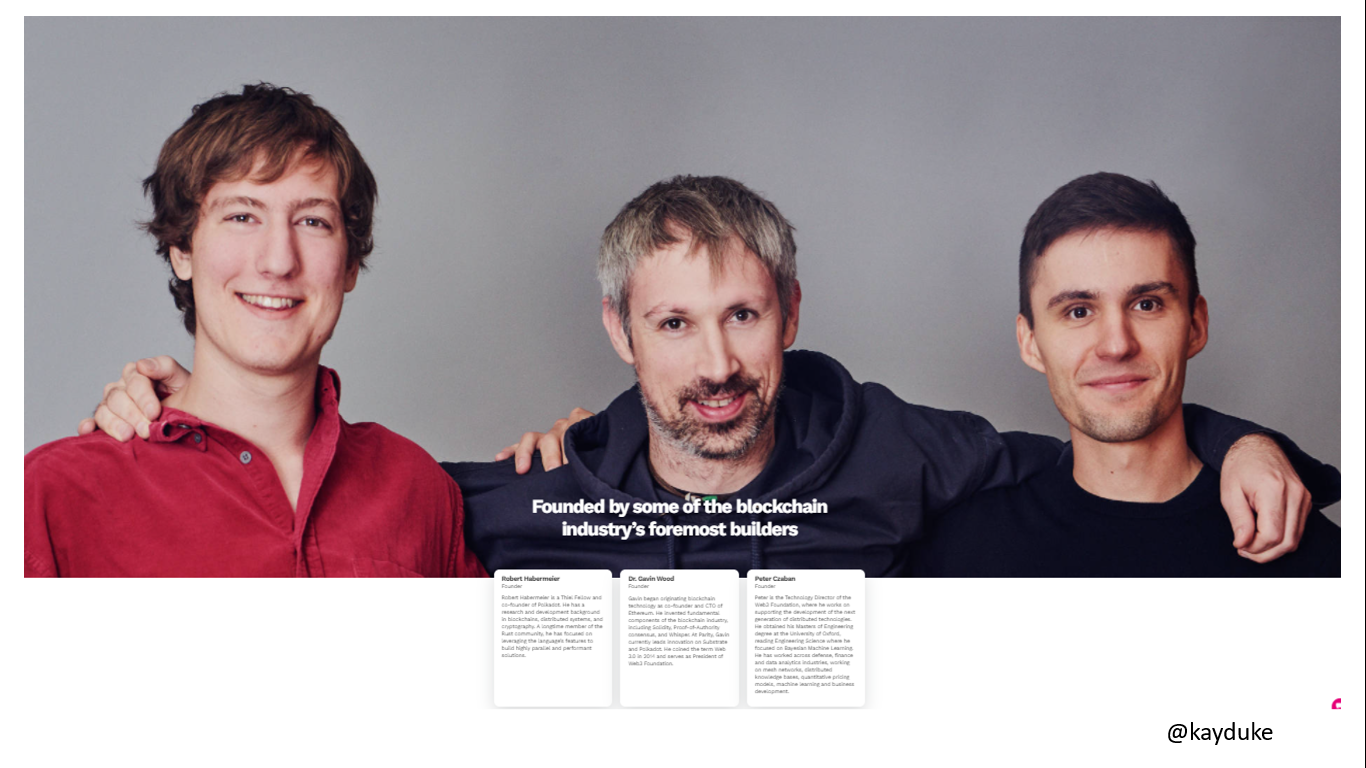
Polkadot is an open source project founded by Dr. Gavin Wood, co-founder of Ethereum; Robert Habermeier, co-founder of Polkadot; and Peter Czaban technology director of Web 3 Foundation.
.png)
<center><sub>screenshot from Polkadot official website</sub></center>
With Polkadot, there is some sort of interoperability among different blockchains, a problem a number of traditional blockchain networks have been unable to resolve.
Also, the Polkadot network boasts of high scalability where transactions are spread across multiple parallel blockchains ensuring quick transaction processing. It uses a Proof of Stake mechanism to achieve consensus on the network.
The token that powers the Polkadot network is the Dot token. Holders of the token have control and are part of the governance of the network. The token can also be staked.
Objectives of the Polkadot network
When you visit the official website of the Polkadot network, you will see from its mission statement that Polkadot is created to integrate private and consortium chains, public and permissionless networks, oracles, and yet-to-be-created technologies. Through the Polkadot relay chain, Polkadot provides a network where separate blockchains can share information and transactions in a trustless manner and also providing speed, solving issues of scalability and lesser transaction fees compared to competitors like Ethereum.
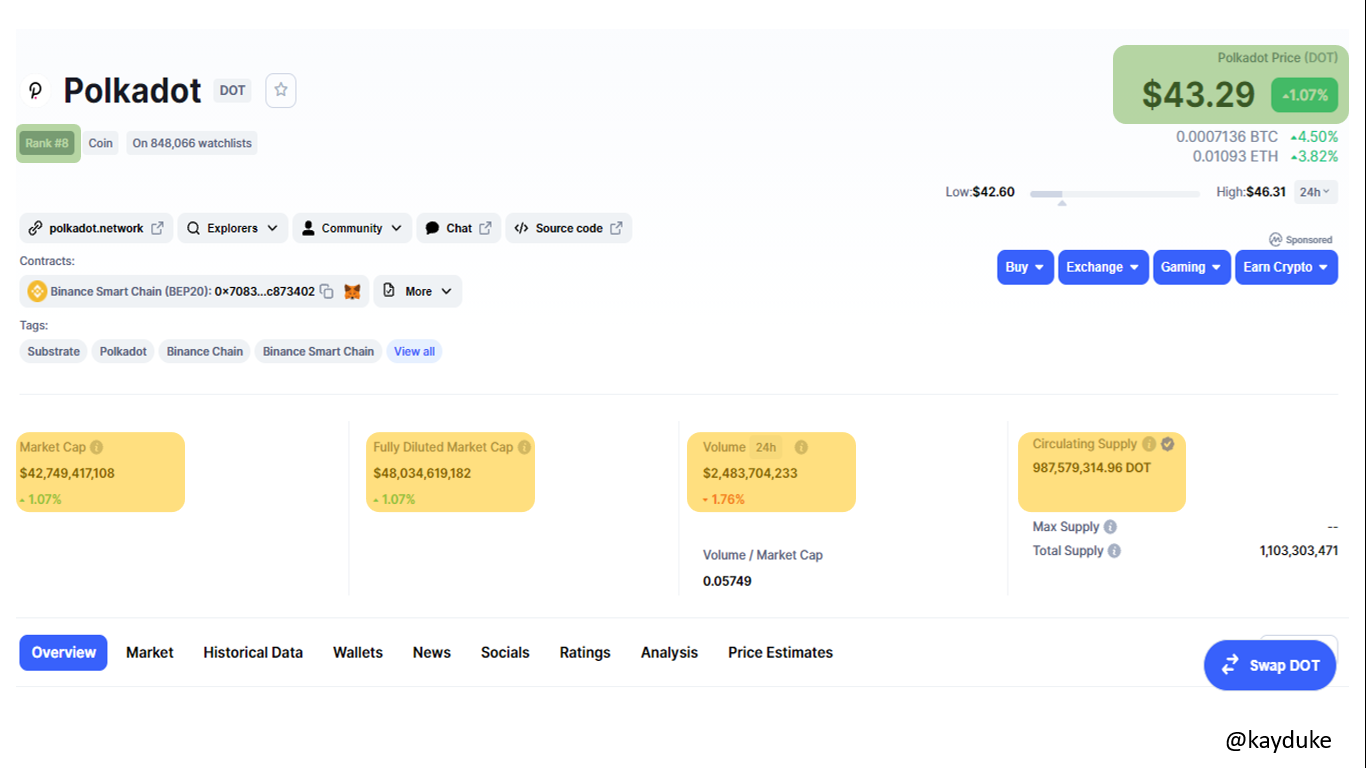
Now let's examine the Polkadot token (DOT). Below are the details of the token from Coinmarketcap at the time of preparing this work below:
.png)
<center><sub>screenshot from CoinmarketCap</sub></center>
From the screenshot above, DOT coin ranked 8th and the price was $43.29. Among other details of the DOT coin is a **market cap** of $42,749,417,108; **fully diluted market cap** of $48,034,619,182; **24hr volume** of $2,483,704,233; **circulating supply** of 987,579,314.96 DOT.
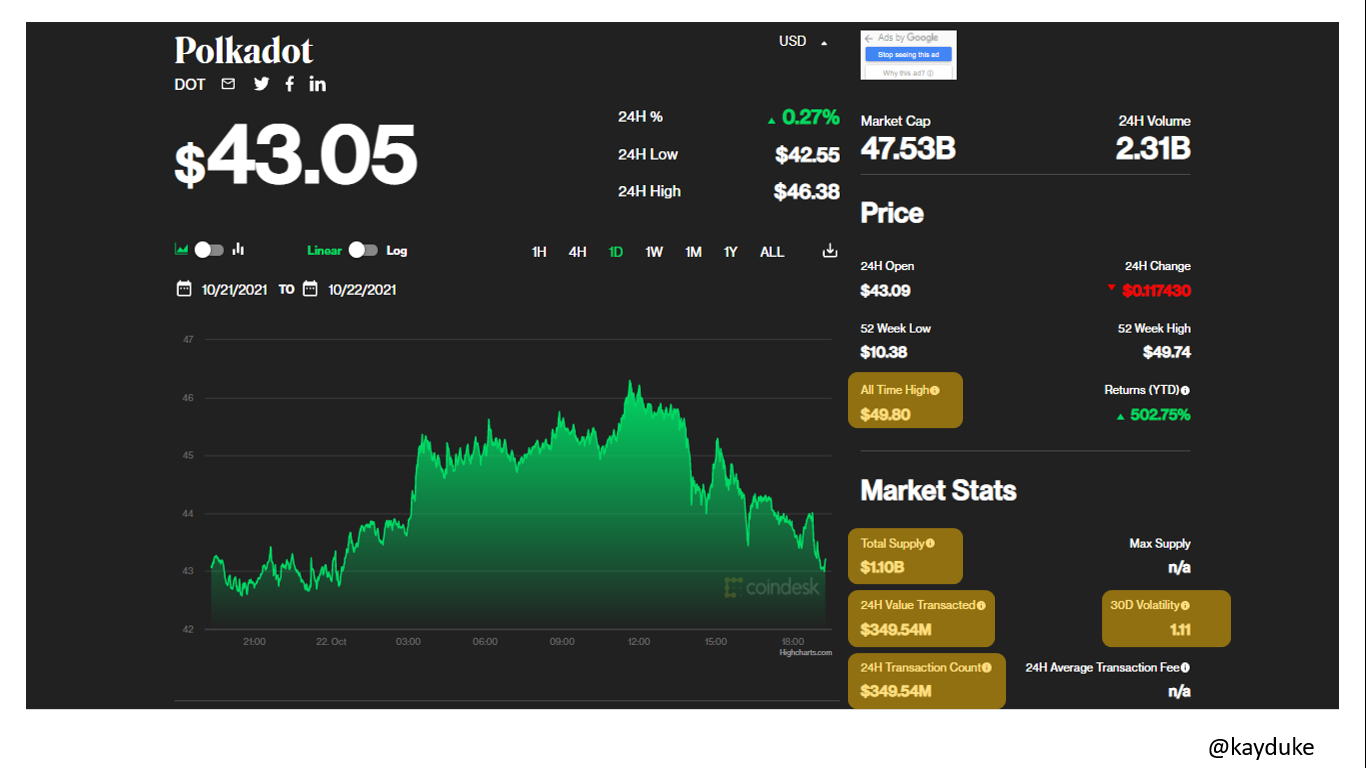
More details of the DOT coin as provided by Coindesk are shown below
.png)
<center><sub>screenshot from Coindesk</sub></center>
With an **All time high** of $49.80; **24H Value Transacted** is $349.54M; **Total Supply** is $1.10B; **30D Volatility** is 1.11.

-------
>Make a purchase from your verified account of at least 10 USD of the currency selected in the previous point. Describe the process.
-------
I will perform this trade using Binance.
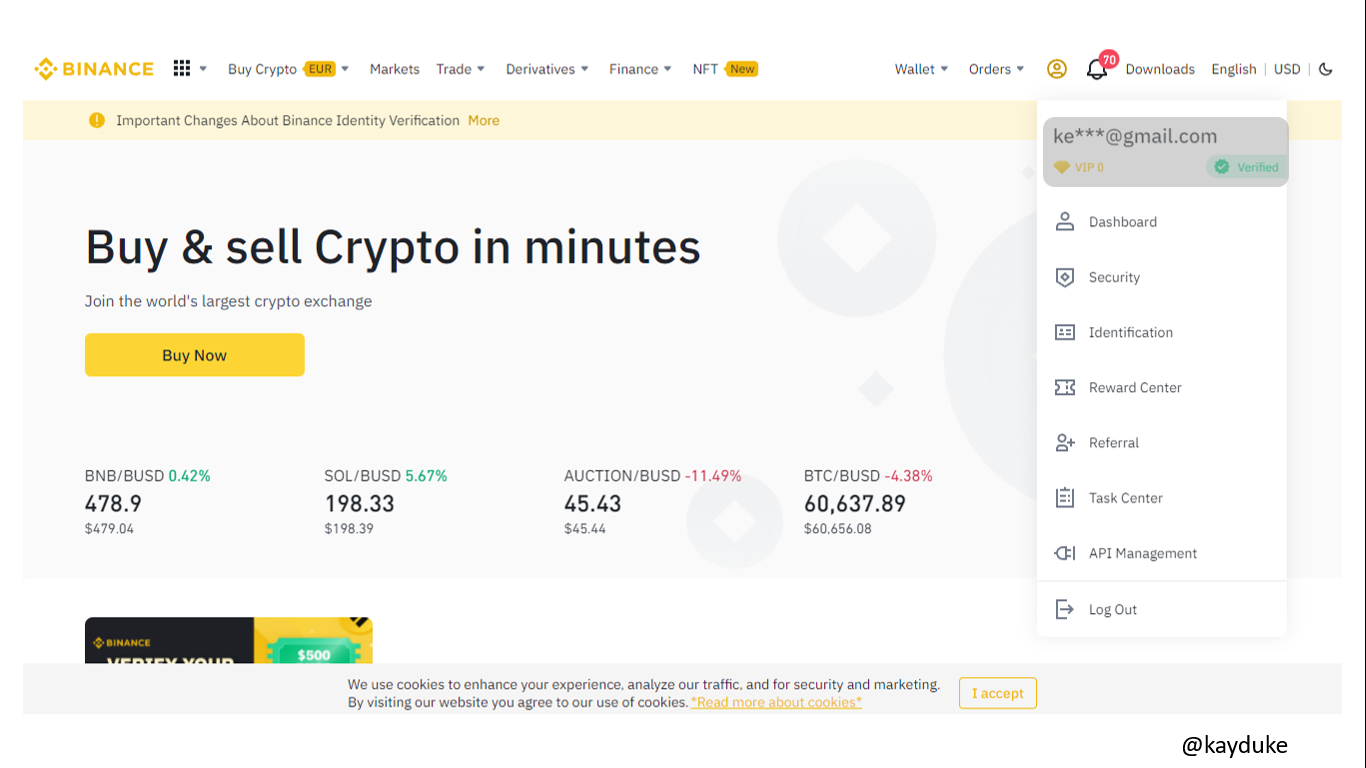
Log into your Binance account
Successful log in, proof of verified account.
.png)
-------
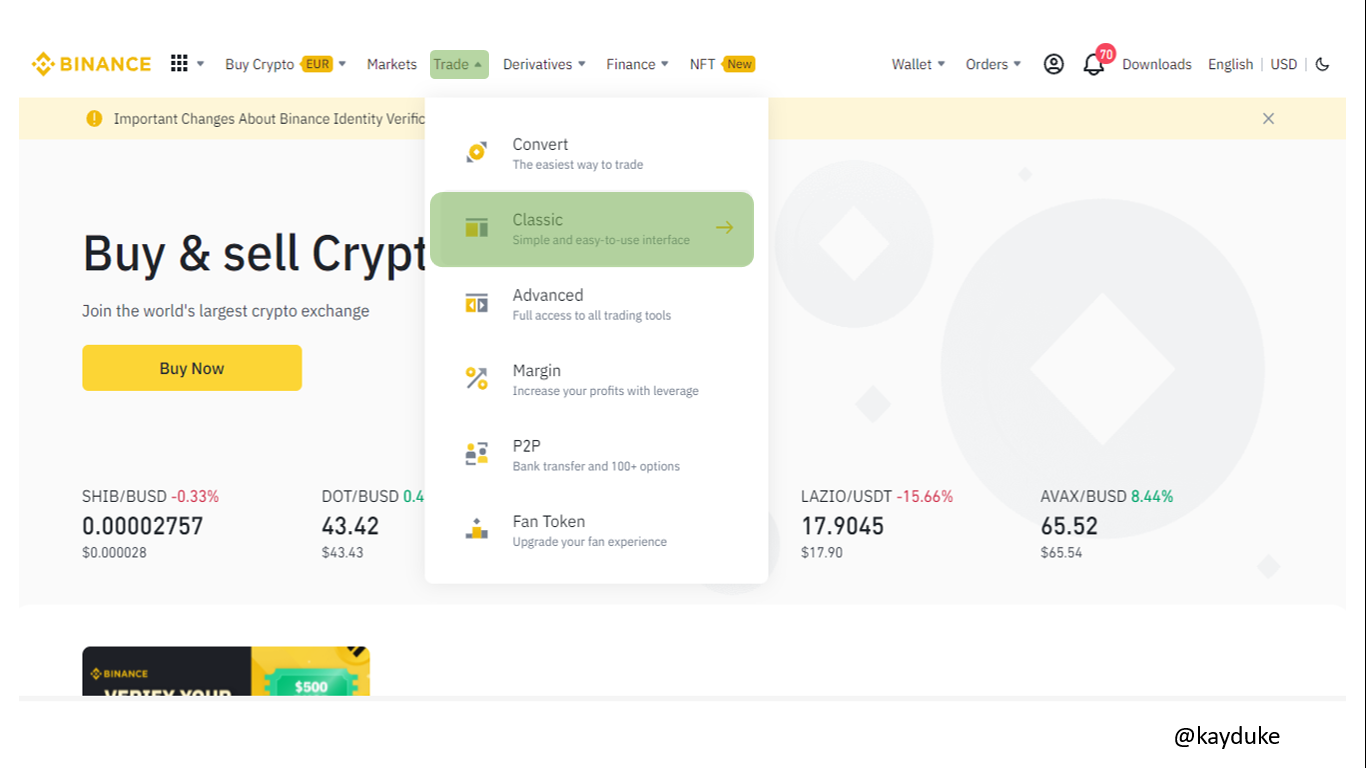
Enter trade by clicking on the Trade tab and choose Classic from the drop-down menu that appears.
.png)
-------
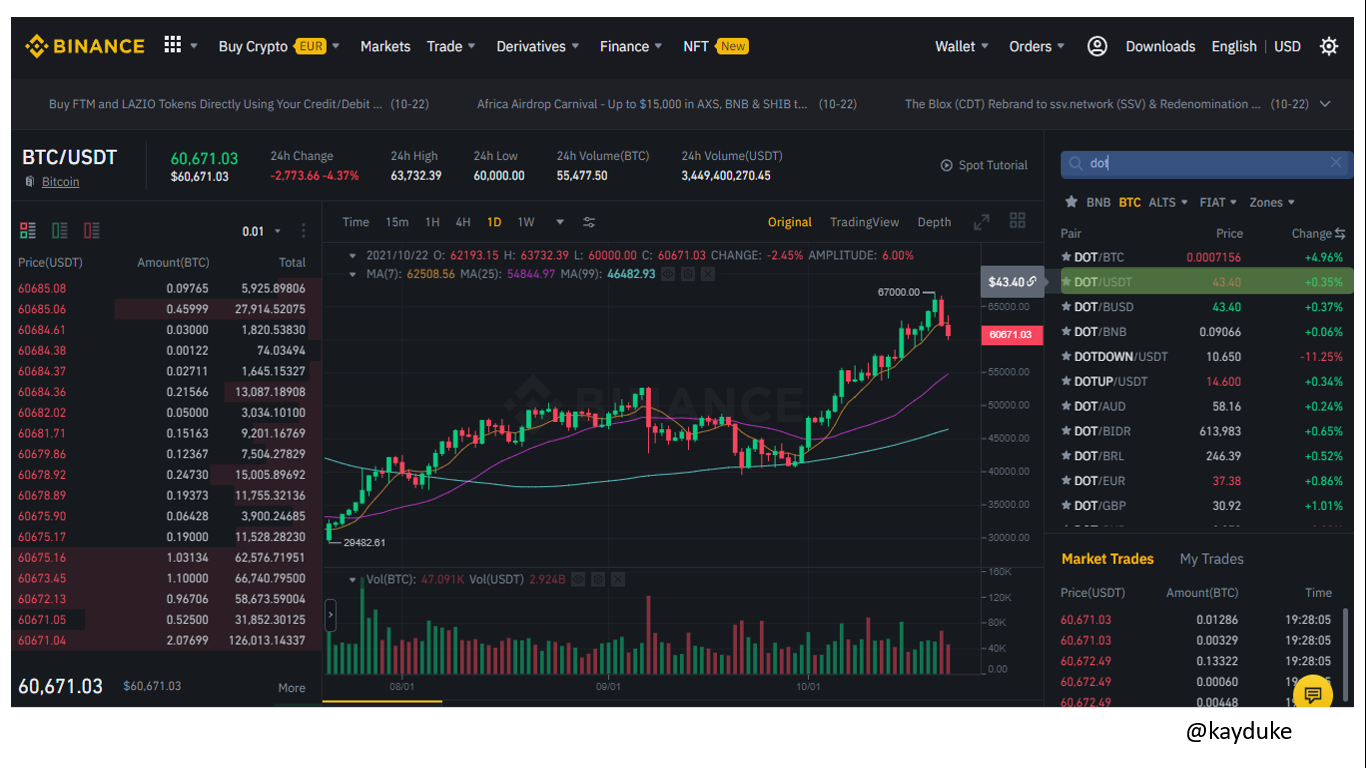
Change the default crypto pair to the one you want to work with, in my case DOT/USDT because I already have some USDT I will like to exchange for DOT.
.png)
-------
Enter the amount of USDT you are willing to exchange and see the corresponding DOT value you will receive in return. Set your price and hit Buy DOT.
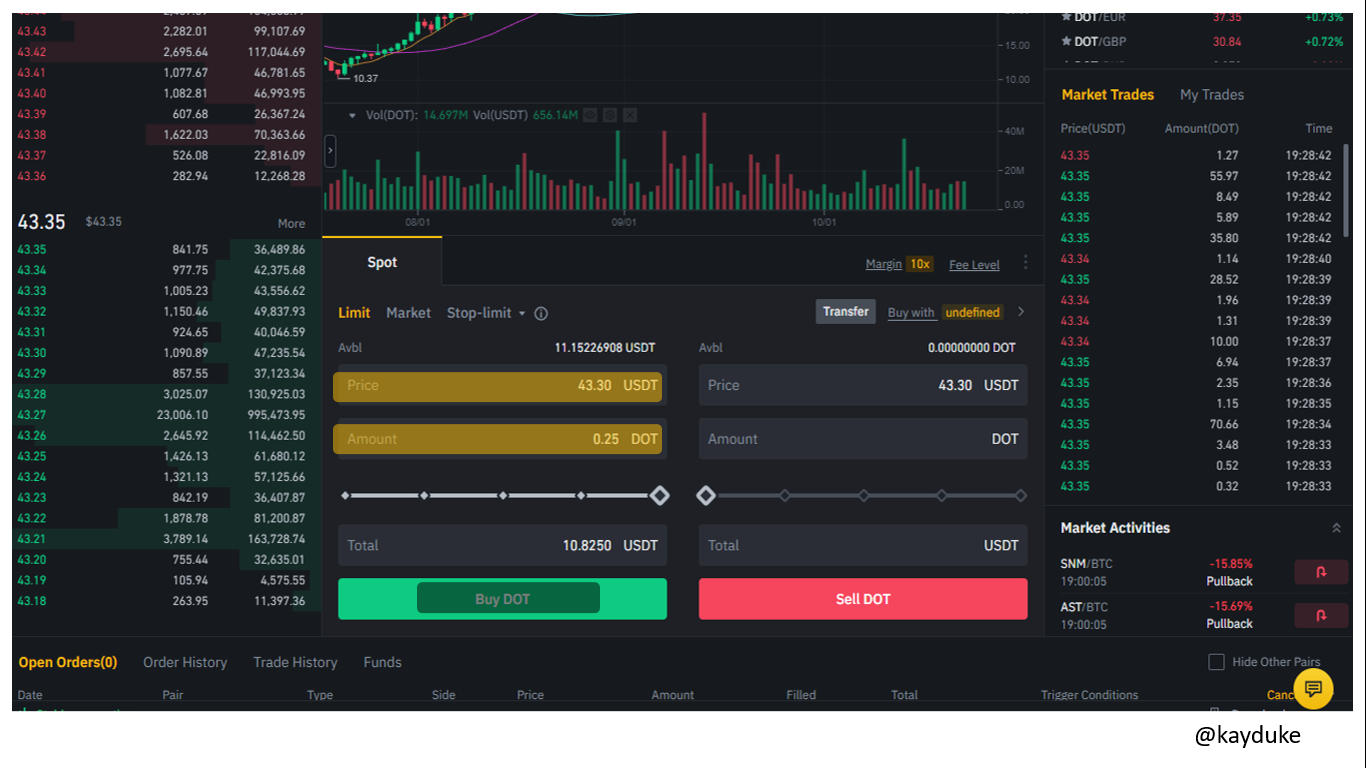.png)
-------
The order was not filled instantly because my price was a bit lower than the current market price.
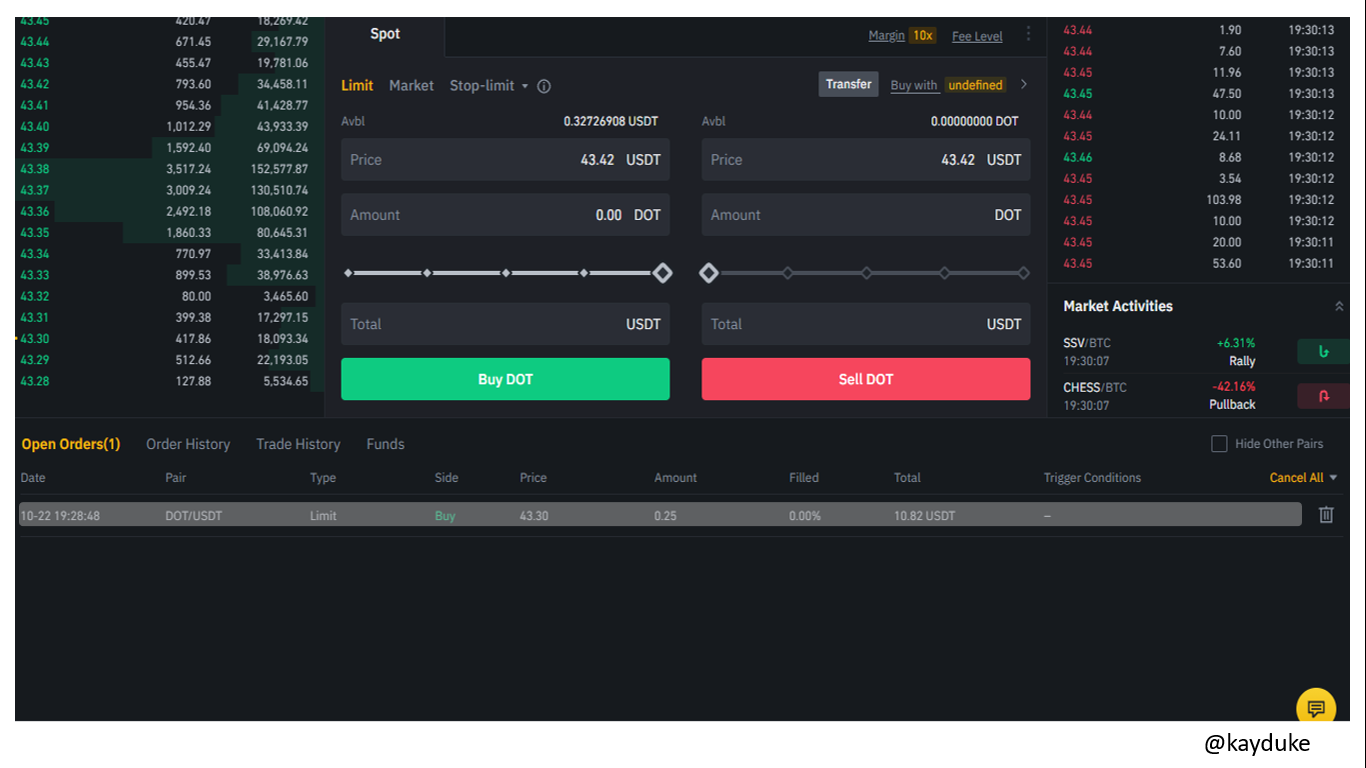.png)
-------
After some time, the buy order was executed and it appears in my wallet as seen below
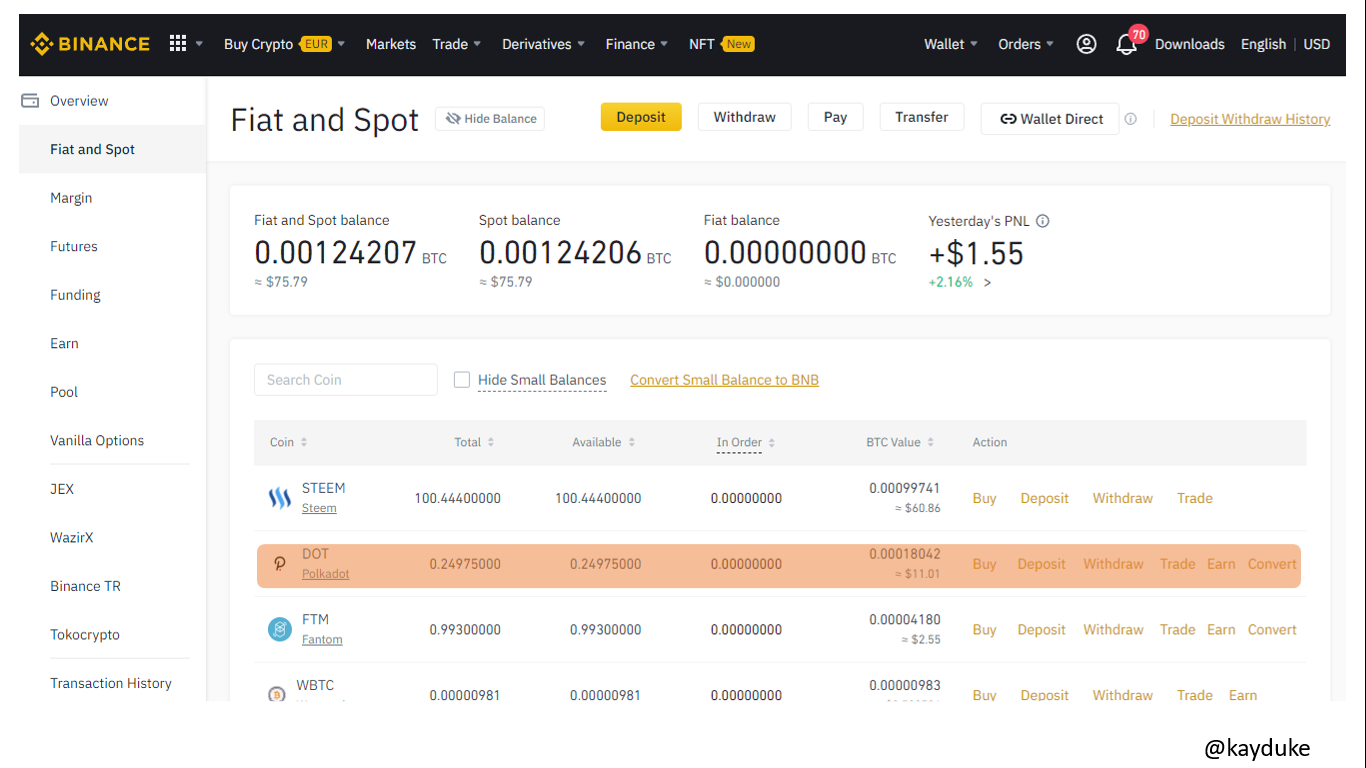.png)
**All screenshots are from Binance**

-------
>Apply Fibonacci retracements to the previously selected asset with a 4-hour time frame on the platform of your choice. Observe the evolution of the price at 24 and 48 hours, did it go up or down in value? Look to identify resistance and support levels.
-------
I will undertake this part of the exercise via Trading View.
Launch the DOT/USDT chart and set the time frame to 4hrs as required.
For my 24hrs observation, I will use price data for October 13th.
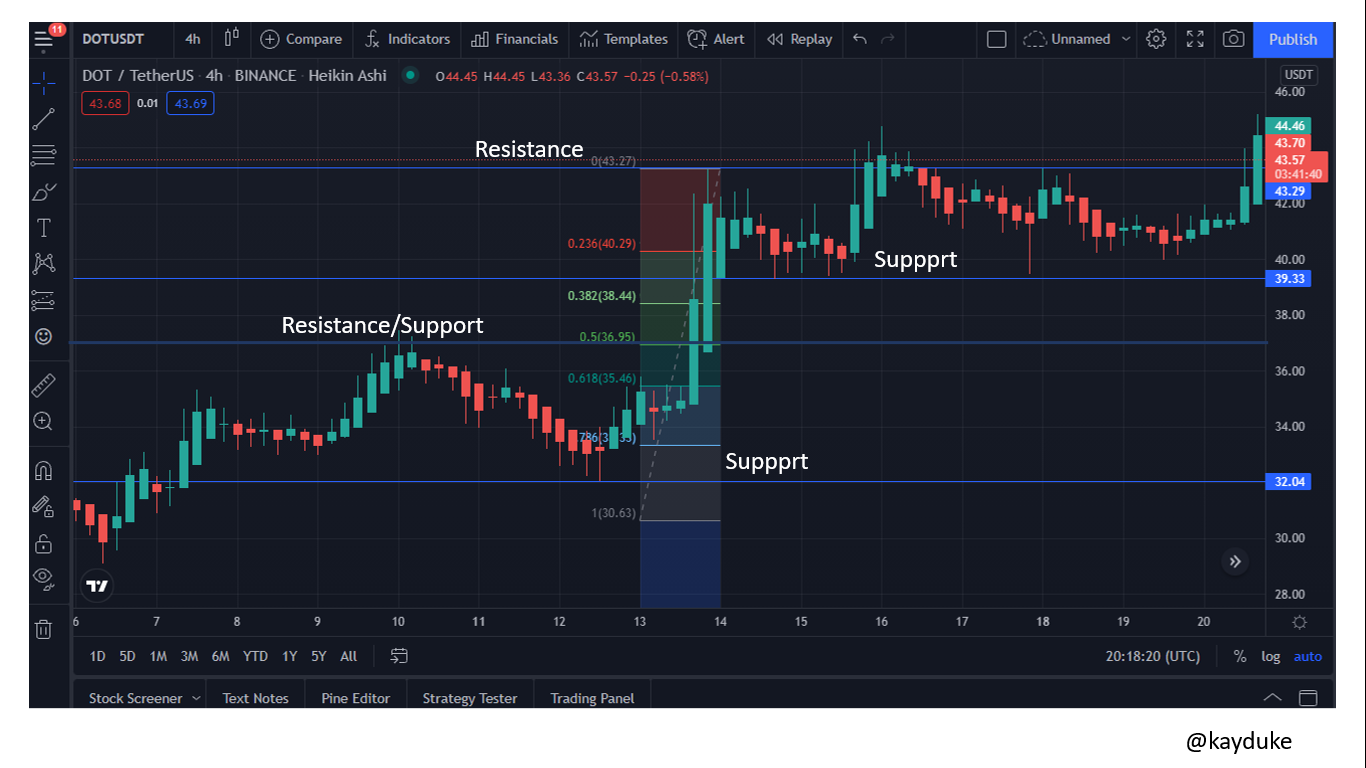.png)
<center><sub>screenshot from TradingView</sub></center>
From the chart above, support and resistance levels were easily identified using the Fibonacci retracement tool as guide.
In all, an uptrend was identified as the low corresponds to 1 or 100%, and you see the high point also correspond to the value 0 (0%).
-------
For the 48hrs observation, I will use price data for October 13th and 14th.
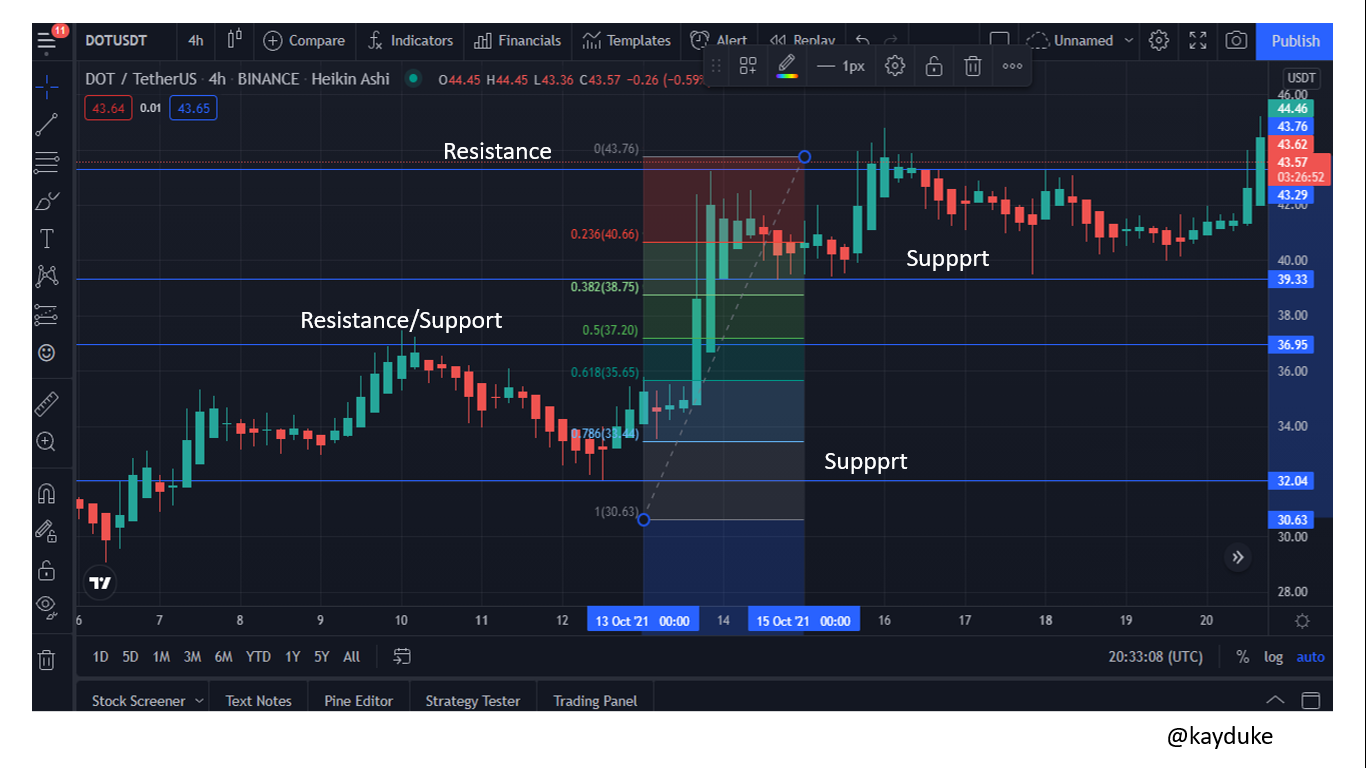.png)
<center><sub>screenshot from TradingView</sub></center>
From the chart above, support and resistance levels were easily identified using the Fibonacci retracement tool as guide. The trend continued upwards though there was some slight change in movement where the price trend downwards for awhile.

-------
>What are Bollinger Bands? How do they apply to Crypto Technical Analysis? With which other tool or indicator do you combine Bollinger Bands to analyze a Crypto?
-------
Bollinger Bands is a technical analysis tool or indicator used by traders to identify and predict market trends. Developed by John Bollinger, it comprises of three lines, a moving average line usually in the middle; and an upper and lower bands which are positive and negative standard deviations from the moving average.
With Bollinger bands, traders can tell if an asset is overbought or oversold. An asset is said to be in the overbought region when the price is closer to the upper band whereas an asset is in the oversold region when it is closer to the lower band. With this information and the same understanding we have for an overbought or oversold asset, traders can make trading decisions i.e you sell when the asset has entered the overbought region and you buy when the asset is in the oversold region.
See screenshot below
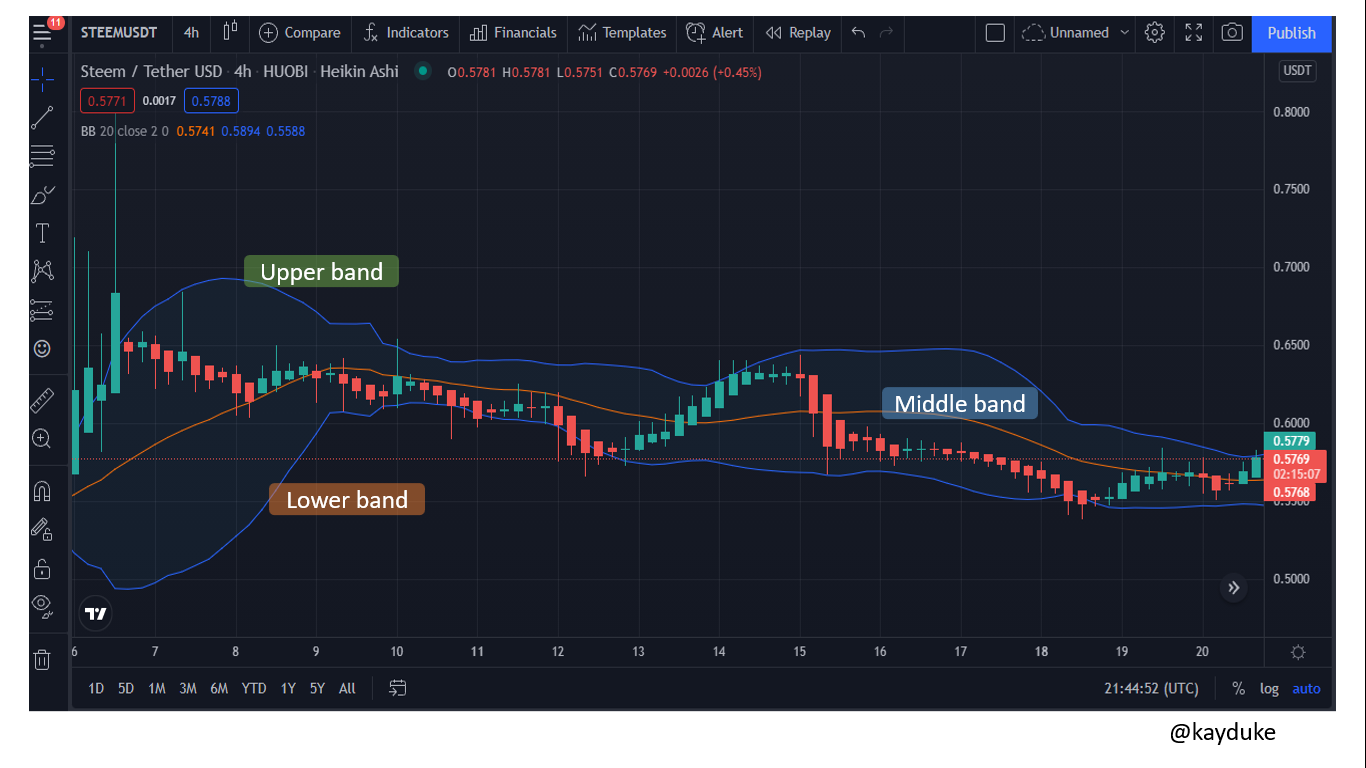.png)
<center><sub>screenshot from TradingView</sub></center>
-------
Remember we cannot trust our trading decisions in a single indicator so with Bollinger bands too, we can complement it with other technical indicators to confirm the signals. For this, I will add the Stochastic indicator to the Bollinger bands and see if they send the same signals. The stochastic indicator also helps identify if an asset is overbought or oversold making it an appropriate complement to the Bollinger bands.
See screenshot below
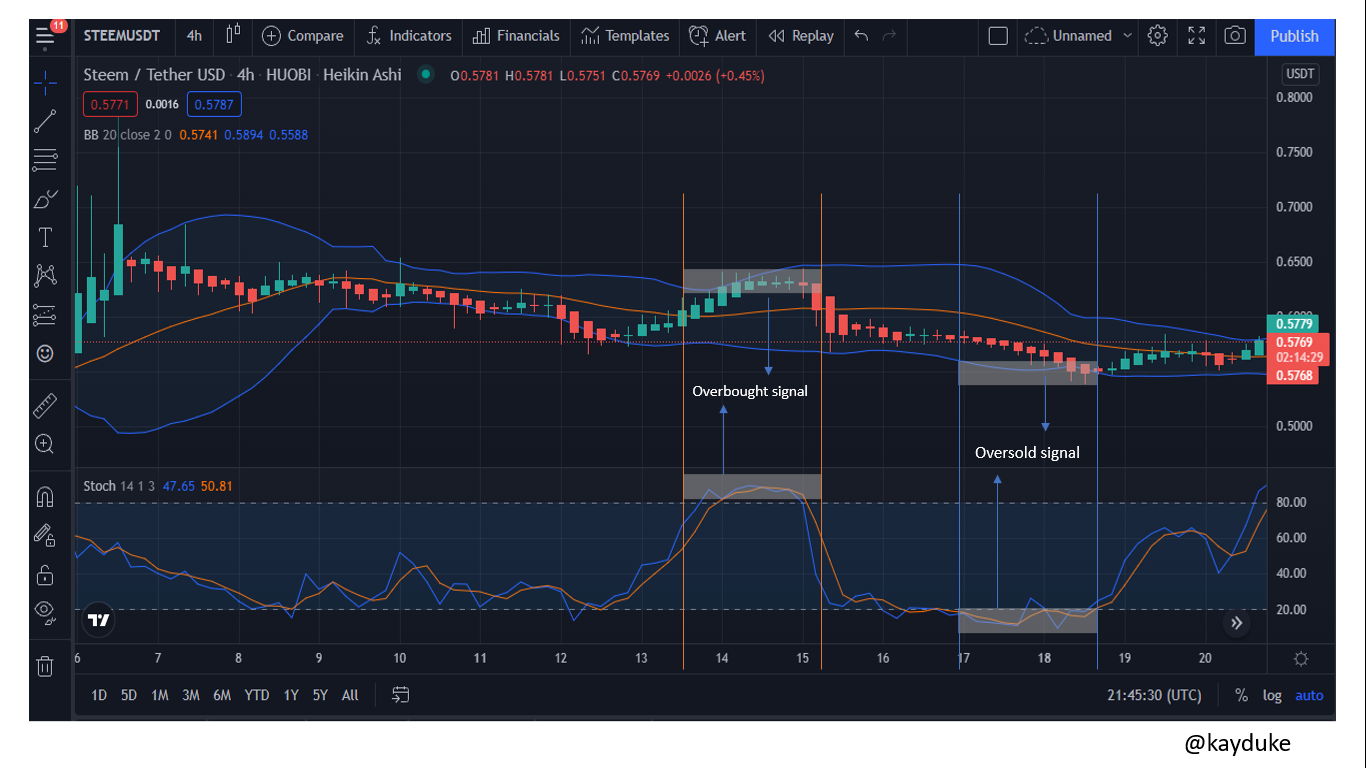.png)
<center><sub>screenshot from TradingView</sub></center>
Here, you see some confluence in the signals the Bollinger bands and Stochastic indicator presents. Where the price is seen rising towards the upper band we see the price cross the 80 mark on the stochastic indicator indicating that the asset has entered an overbought region and where the price is falling towards the lower band we see the price also go below the 20 mark on the stochastic indicator too.

-------
### Conclusion
Performing analysis be it fundamental or technical analysis is one of the important step every trader should consider before trading or investing. Whereas fundamental analysis is concerned with finding the intrinsic value of an asset, technical analysis on the other hand uses previous price movement and behavior to predict future price behavior and also identify market entry and exit points. However, doing both analysis is more prudent and reduces the risk of loss.
Thanks for reading and big credit to @imagen for this insightful lecture. </div>
Regards
@kayduke