MONTHLY CHART
![041918 bit.png](https://steemitimages.com/DQmPwgmf8ennXuAfqmLUyKwtnh7LF3MYJirv4CUUEUQuB8L/041918%20bit.png)
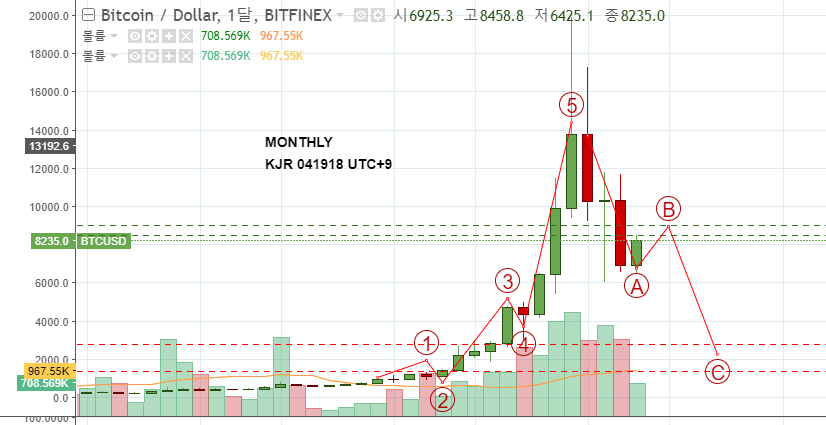
In monthly chart, It's possible to raise to 50 ~ 61.%8 from dropped price
WEEKLY CHART
![041918 bit weekly.png](https://steemitimages.com/DQmZn1ZbyWTrUSRn7npTbFmKLxUVjbdwVcxgJ3VjbbaPAXg/041918%20bit%20weekly.png)
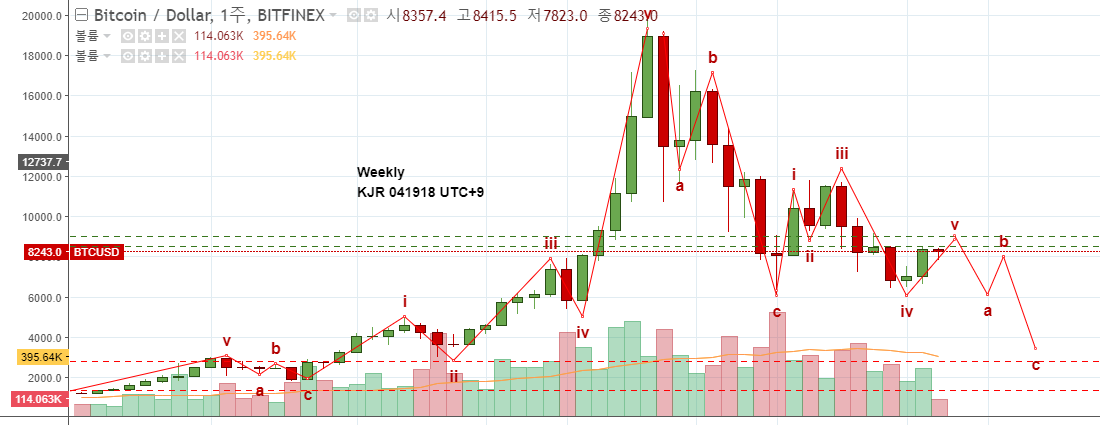
In weekly chart, here've seem the wave's pregressin' to 5 wave
DAILY CHART
![041918 bit daily.png](https://steemitimages.com/DQmbZwH6WmGwejNf3WQnEyWMKzfN4zPPtm71Fsrm42HNJcM/041918%20bit%20daily.png)
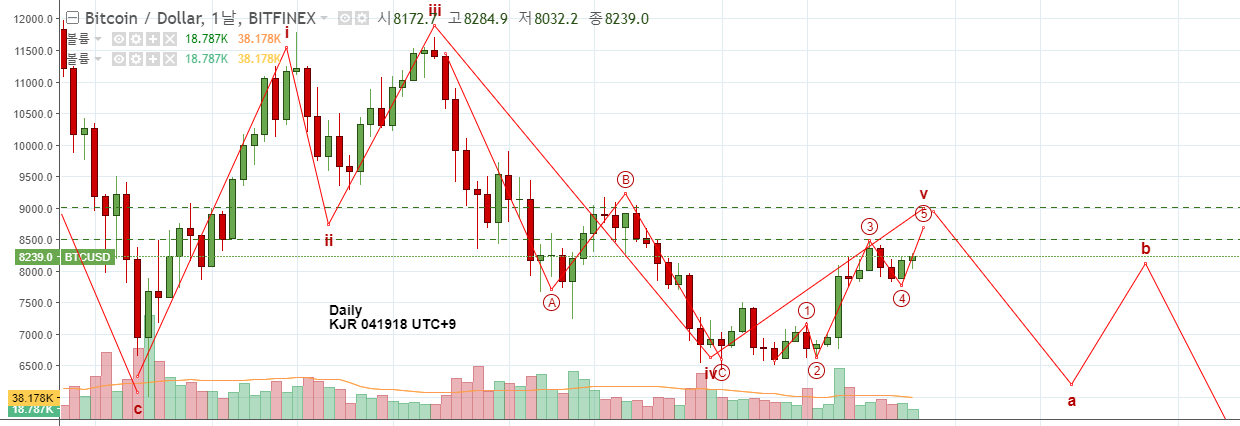
In hourly chart, here've also seem the 5 wave's in progress
HOURLY
![041918 bit hourly.png](https://steemitimages.com/DQmV5NTaZdUXUwC2F6DpmrXmm63MXDTcyCEnxL5i7CYrFL6/041918%20bit%20hourly.png)
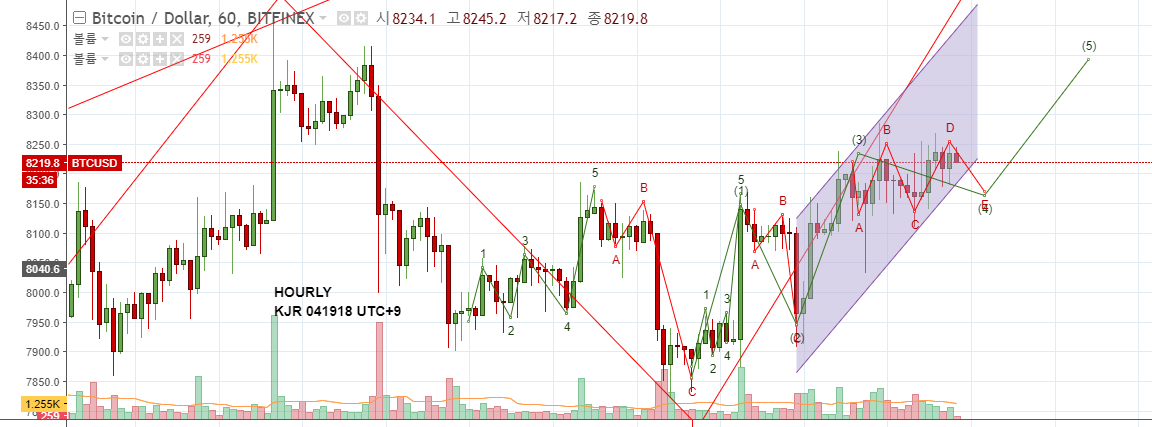
In hourly chart, here've seem the sideways wave's in 4 wave preparin' to start 5 wave
have to notice that if buyin' volume is more then 3 wave that will make expanded 5 wave
or less than 3 wave will make failure