
<div class= "text-justify">
Trading without analyses is just loss. That why we use different tool that help us to mature in trading field. In this lecture, professor once again explain the most importance volume indicator. Traders use this indicator most of time to determine the actual money flow, liquidity and market trend. I have learned how to trade using Chaikin Money Flow indicator. Professor mentioned few questions at the end of lecture in quest of more understanding about this indicator.

<center>**Question no. 1**</center>
## In your own words, give a simplified explanation of the CMF indicator with an example of how to calculate its value?
## Chaikin Money Flow (CMF)
Chain Money Flow indicator is developed by well know stock market analyst Marc Chaikin. It is a type of volume indicator that is use in trading to determine the amount of money poured in a specific token and amount of money is out from a particular asset. It is also use to determine the buying and selling pressure. It is the most effect indicator that provide most effect buying and selling signals even in a market making concept and others.
The volume of the asset represents the interest of the investor. If the Volume is high, then it indicates that investors are highly interested in that particular asset. On contrary, when volume is low, then investor take no interest in that particular asset.
<center><sub> Fig. 1| Screenshot form<sup> [Investing.com]( https://www.investing.com/charts/cryptocurrency-charts)</sup></sub></center>

## Working of Chaikin Money Flow Indicator.
The chart of that is moving between the value of to +1 to -1. When chart line is presented on the positive up side then it says that traders are interested in this token and invest money in this particular asset. When chart line is presented on the negative down side then it says that traders perform selling the token of this particular asset.
When the indicator line lies on the above of 0 line, then it indicates that the market is on uptrend. When the indicator line lies on the below of 0 line, then it indicates that the market is on down trend. Working of this indicator is similar is some cases with Accumulation and Distribution indicator.

## Calculation of Chaikin Money Flow
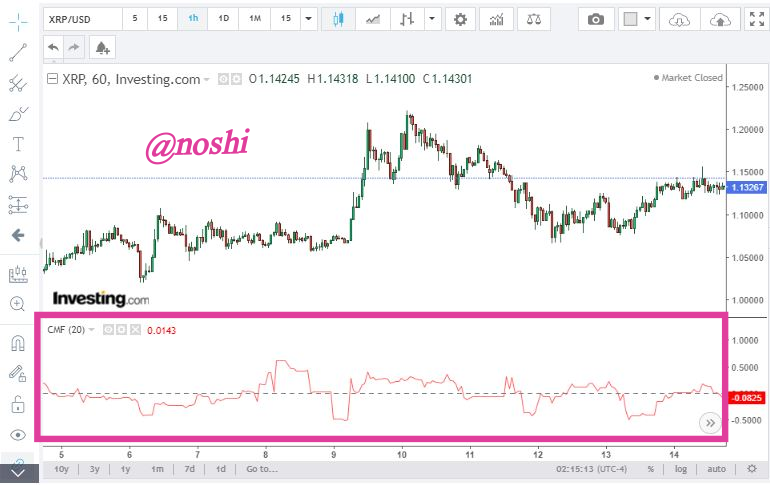
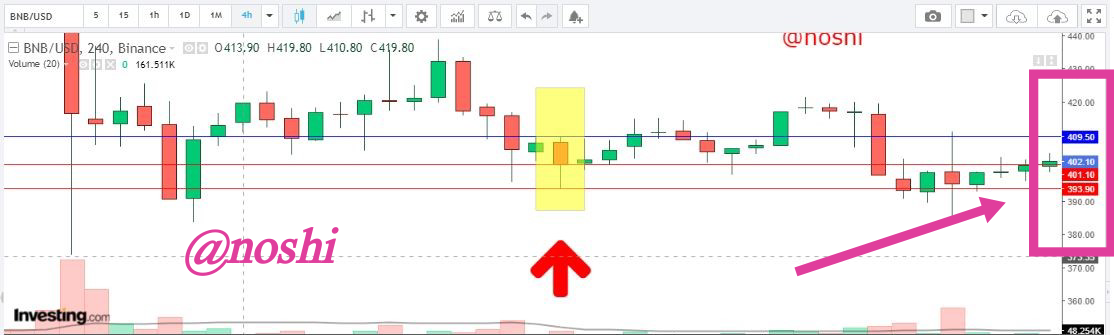
Calculation of Chaikin Money flow is done is few steps. There are few other formulas are including in the calculation process. We have three basic formulas of calculating the CMF. I will elaborate each formula and get the value of formula by adding the values. The Values are taken form the chart of BNB/USD at investing.com at 4H time period.
<center><sub>Fig.2 | Screenshot form<sup> [Investing.com]( https://www.investing.com/charts/cryptocurrency-charts)</sup></sub></center>
We have the first formula that is mentioned in figure. In this formula there are four values are displayed. Closing Price, Highest price, Lowest price and Volume of current candle is required in this formula. All the parameters of formula are displayed in the figure.
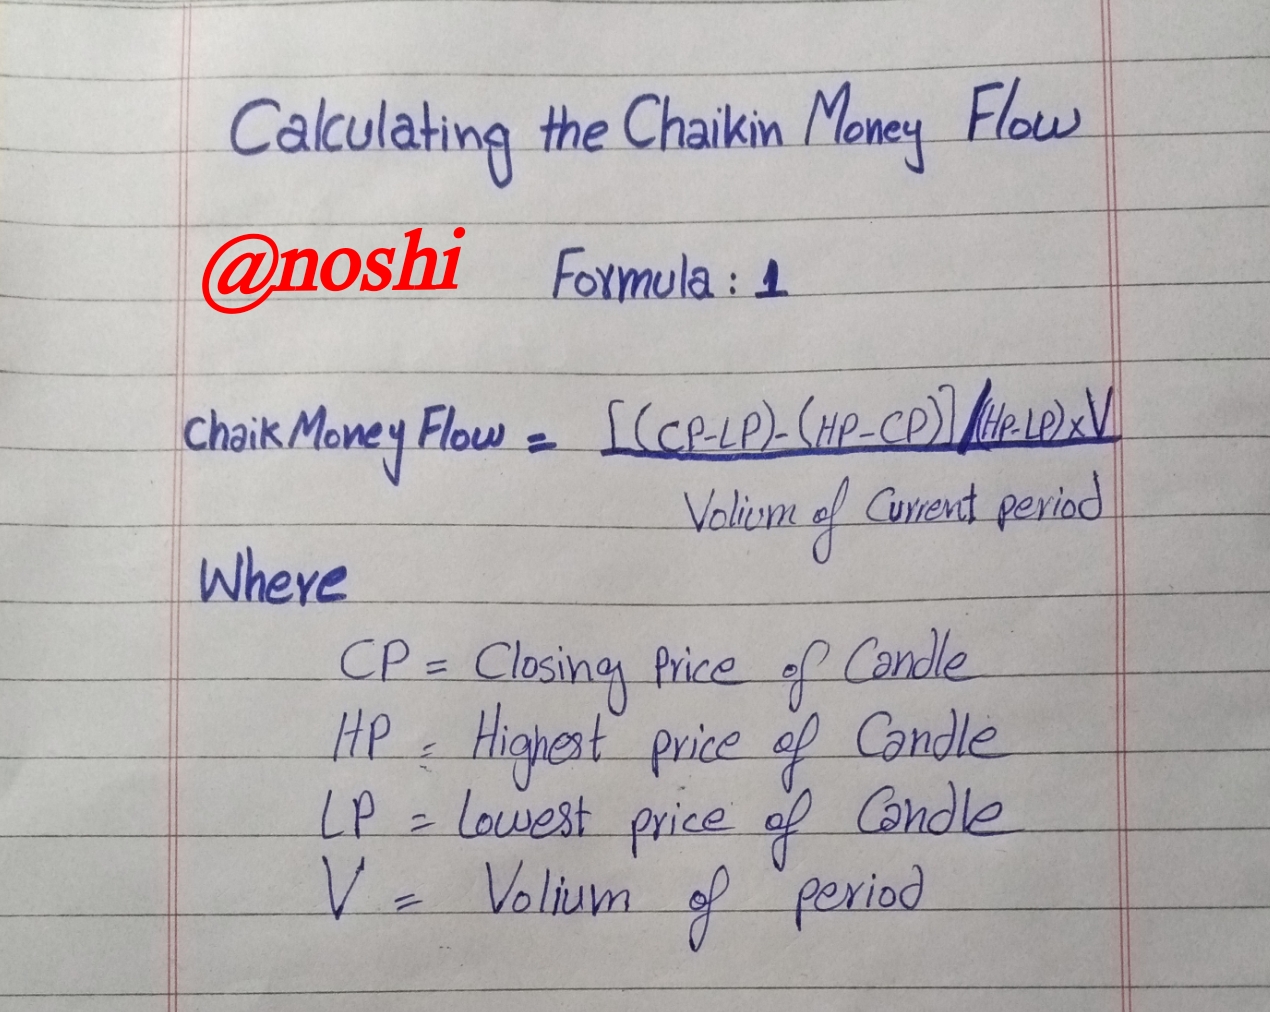
<center><sub> Fig. 3| CMF Formula: 1</sub></center>
Now, we calculate the values of formula by putting the values. To get the value of formula elements, we have to go on website that is investing.com. Here I choose BNB/USD chart. In the following figure all the values are mentions in the following figure.

According to Figure the Values are:
<b>
Closing =$401.10
High= $409.50
Low= $393.90
Volume of Current candle = 44.637K
Total Volume = 138.283k</b>
***
### CMF= [(401.10 -393.90) - (409.50-401.10)]/ (409.50- 393.90) x 44.637000 /138.283000
CMF= [(7.2) – (8.4)]/ (15.6) x 44.637000 /138.283000
CMF= [7.2 – 8.4]/ (15.6) x 44.637000 /138.283000
CMF= -1.2/15.6 x 44.637000 /138.283000
CMF= -0.07692x 44.637000 /138.283000
CMF= -0.07692x 0.3228
<center>**CMF= -0.024 <sub>In three significant figures</sub>**</center>

## Now we calculate the Cash Flow Multiplier
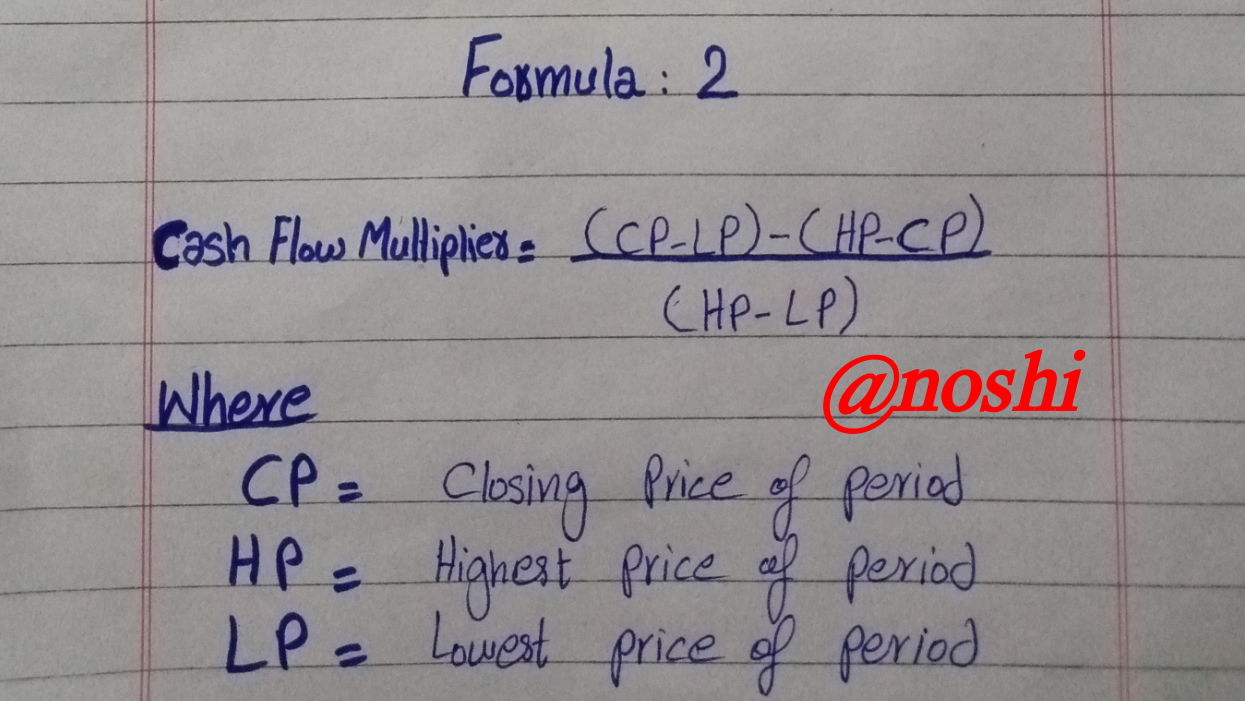
<center><sub> Fig.4 | CFM Formula: 2</sub></center>
According to Figure the Values are:
<b>
Closing =$401.10
High= $409.50
Low= $393.90
</b>
CFM= (401.10-393.90)-( 409.50-401.10)/( 409.50-393.90)
CFM= [(7.2) – (8.4)]/ (15.6)
CFM= [7.2 – 8.4]/ (15.6)
CFM= -1.2/15.6
<center>**CFM= -0.07692**</center>

## Now we calculate the Volume of Cash Flow
<center><sub> Fig.5 | VCF Formula: 3</sub></center>
According the formula that is mention in the above figure, we need Cash Flow Multiplier and volume to get the values of VCF.
VCF= -0.07692 x 44.63700
<center>**VCF= -3.4336**</center>

## New we put the values of all elements in the final formula.
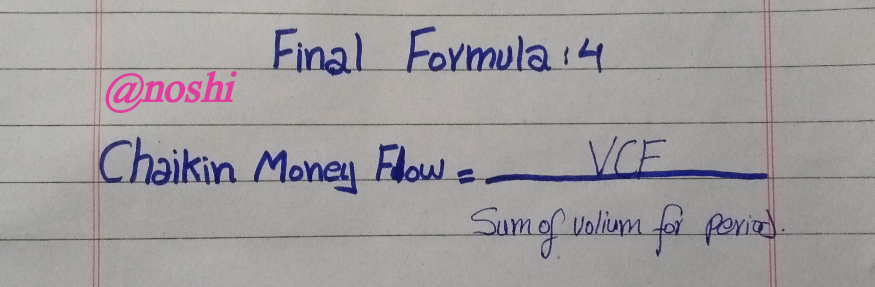
<center><sub> Fig.6 | CMF Formula: 4</sub></center>
CMF= VCF/Total volume of Period.
CMF= -3.4336/ 138.283
<center>**CMF= - 0.024** <sub>In three significant figure</sub></center>

In this way, we calculate the Chaikin Money Flow value. We deduce the value of this CMF form two method. As you notice that we get the same value from both formulas. You can compare both values.

<center>**Question no 2**</center>
## Demonstrate how to add the indicator to the chart on a platform other than the trading view, highlighting how to modify the settings of the period (best setting).(screenshot required)
I chose investing.com platform to apply the indicator on the chart. For applying the indicator on the chart, first, you need to open the chart on a particular website. So, first you need to visit [Investing .com]( https://www.investing.com/charts/cryptocurrency-charts). After entering the website, you need to click on the chart button as mentioned in the figure. Then select the asset pair that we want to analyze.
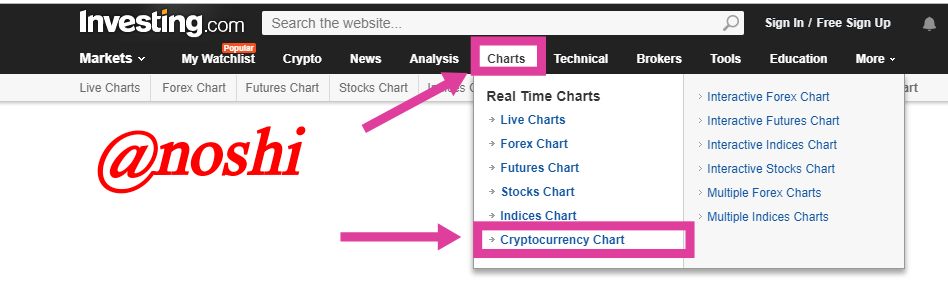
<center><sub> Fig.7 | Screenshot form<sup> [Investing.com]( https://www.investing.com/charts/cryptocurrency-charts)</sup></sub></center>
After selecting the pair, you need to click on the Indicator button as shown in figure.
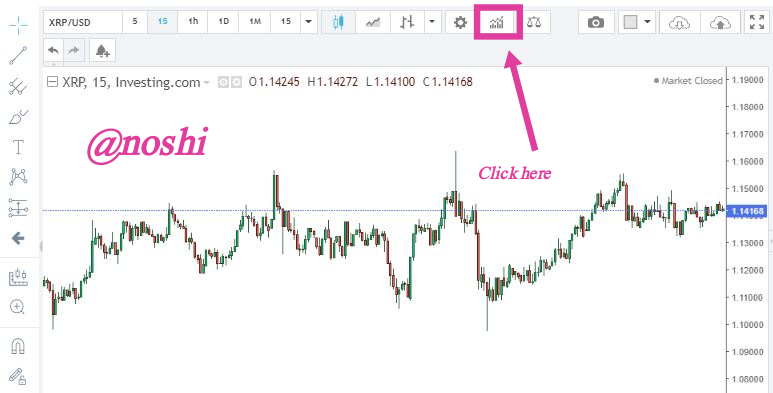
<center><sub> Fig.8| Screenshot form<sup> [Investing.com]( https://www.investing.com/charts/cryptocurrency-charts)</sup></sub></center>

Next, you need to enter the name of indicator here. I write Chaikin. Next, select the mentioned indicator in the figure.
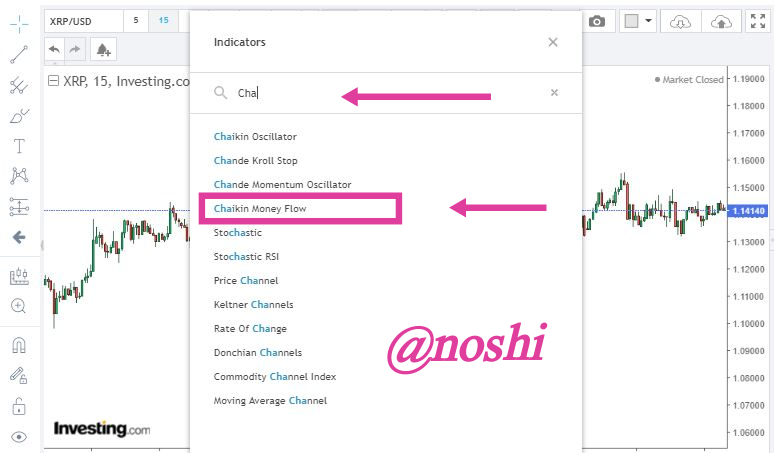
<center><sub> Fig.9 | Screenshot form<sup> [Investing.com]( https://www.investing.com/charts/cryptocurrency-charts)</sup></sub></center>

Here you can see that, the Chaikin Money Flow indicator is applies on the chart.
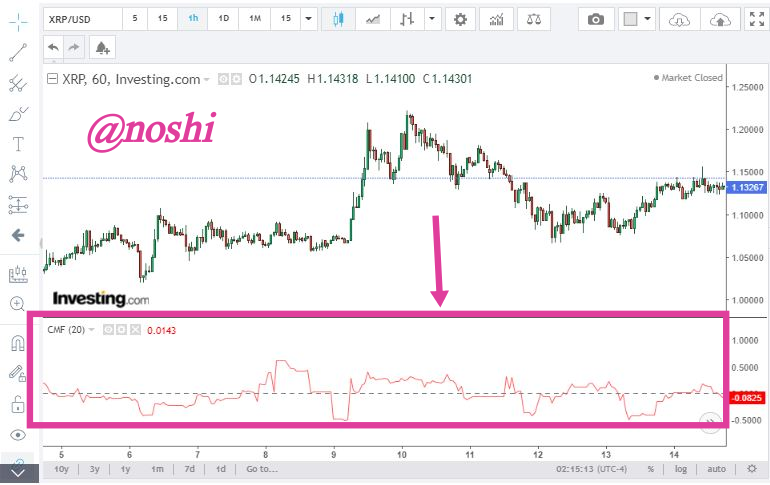
<center><sub> Fig.10 | Screenshot form<sup> [Investing.com]( https://www.investing.com/charts/cryptocurrency-charts)</sup></sub></center>

## How to modify Settings of Indicator?
To change the settings of this indicator, you need to click on the **Setting** button as mentioned in the figure. After clicking on the button the setting window is displayed.
**Input**:
In this window, we can change the length of the indicator. Length of indicator changed according to the trading strategy of traders and investors. Write the length in textbox and click the **Ok** Button. In this way our length is applied on the chart.
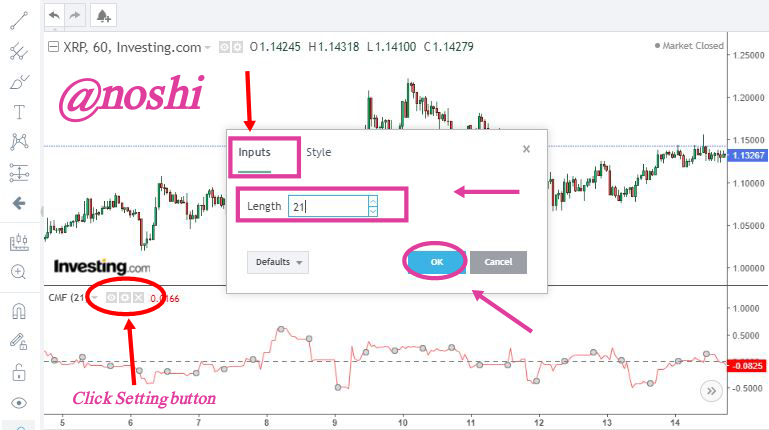
<center><sub> Fig.11 | Screenshot form<sup> [Investing.com]( https://www.investing.com/charts/cryptocurrency-charts)</sup></sub></center>

### CMF Indicator with length of 21.
<center><sub> Fig.12 | Screenshot form<sup> [Investing.com]( https://www.investing.com/charts/cryptocurrency-charts)</sup></sub></center>

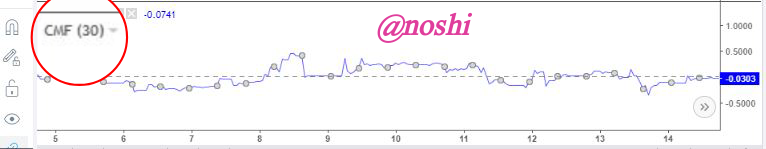
### CMF Indicator with length of 30.
<center><sub> Fig.13 | Screenshot form<sup> [Investing.com]( https://www.investing.com/charts/cryptocurrency-charts)</sup></sub></center>

**Style**:
In this setting, we can change the style of indicator line. We can increase and decrease the thickness of indicator line. We can also change the color of indicator line. Shape of indicator can be changed to dotted line as well. After change the setting of indicator, click on the **OK** Button for applying those settings.

<center><sub> Fig.14 | Screenshot form<sup> [Investing.com]( https://www.investing.com/charts/cryptocurrency-charts)</sup></sub></center>

## What are the best settings of this indicator?
As we know that, in this indicator is designed by Marc Chaikin. He is well known stock market analyst. He develops this indicator for doing the technical analyses of stock market prices. As we know that the stock market in some cases is not similar with crypto market. Stock market is Off at Saturday and Sunday. And also, it has opening and closing time. So, in addition stock market is open 20 to 21 days in a month.
This indicator is designed in way in which they analyze the price behavior over a month of 20 to 21 days. So, according to my point of view, the 20 Length is the best setting. Length setting is depending on the trading strategy of trader. If trader want to do short term trading, then trader should you short length. If traders want to do long term trading, long length setting is best for them.

<center>**Question no 3**</center>
## What is the indicator’s role in confirming the direction of trend and determining entry and exit points (buy/sell)؟(screenshot required)
As we discuss above, the CMF indicator is use to determine the buy and selling pressure in particular asset. We can use this indicator for confirming the bearish and bullish trend. We understand the working of this indicator in the above question. The oscillating line of this indicator oscillates between negative and positive values around the 0.
When the indicator line is above the positive side of 0, then the market trend is bullish and price of asset is increased. In this question, I select the BTC/ USD 4H time period chart for analyses. In the chart, you see that the indicator line crosses the 0 line from bottom to top. It indicates the buy signal as well. And we can see that chart price is increased and trend is bullish. In this way, CMF confirm the bullish trend of market.
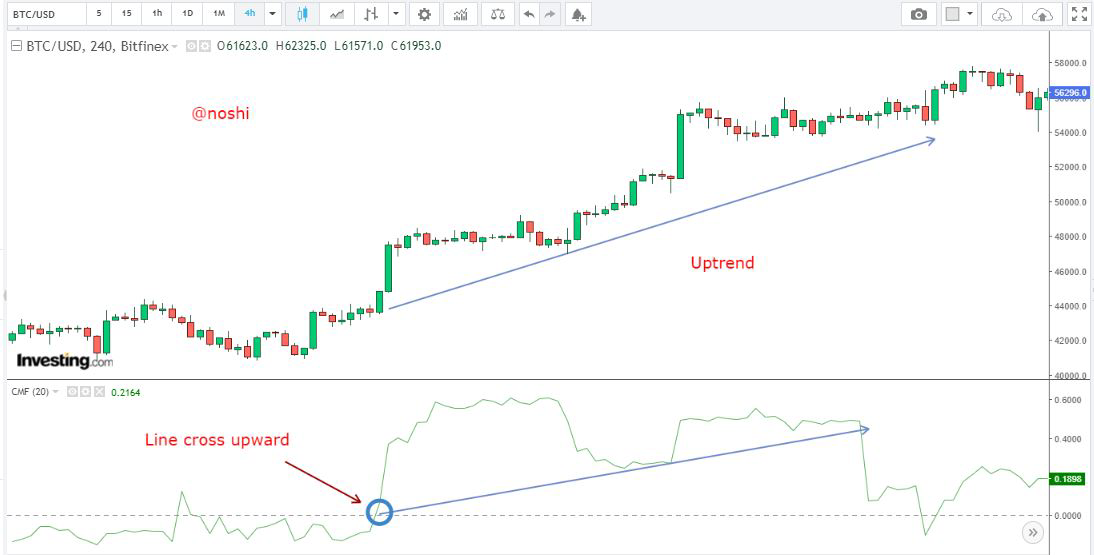
<center><sub> Fig.15 | Screenshot form<sup> [Investing.com]( https://www.investing.com/charts/cryptocurrency-charts)</sup></sub></center>

In the next figure, we can see the both bullish and bearish trend. In this chart, I chose BTC/ USD pair at 4H time period. In this figure, we can see that bullish trend. On the right side of figure bearish trend is made. In which the price of BTC is decreased.
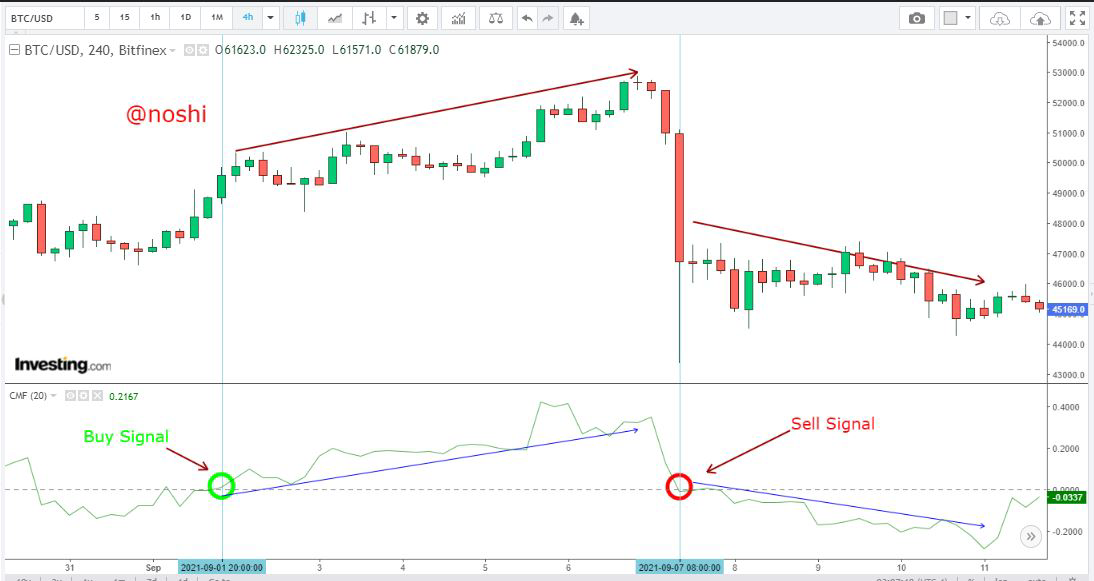
<center><sub> Fig.16 | Screenshot form<sup> [Investing.com]( https://www.investing.com/charts/cryptocurrency-charts)</sup></sub></center>

<center>**Question no 4**</center>
## Trade with a crossover signal between the CMF and wider lines such as +/- 0.1 or +/- 0.15 or it can also be +/- 0.2, identify the most important signals that can be extracted using several examples. (screenshot required)
I chose +/-0.2 and +/-0.1 for filtering the buy and sell signals. First of I explain the +/-0.1 buy and sell opportunities.
### Trade with crossover signal using +/-0.1
I chose XRP/USD pair at 4h time period, for finding the buy and sell opportunity. In this chart, you can see at the bottom in the indicator line. I draw two horizontal line at +/-0.1 for finding the crossovers to determine the buying and selling opportunities.
In the chart, at the left side you can see can the indicator line cross -0.1 line from top to bottom. It indicates the exit and selling signal. And we can see that after this cross the trend of market is bearish as mentioned in the chart with aero.
Next, In the chart, at the Middle of chart, you can see the indicator line cross +0.1 line from bottom to top. It indicates the Buy Signal. And we can see that after this cross the trend of market is Bullish as mentioned in the chart with aero.
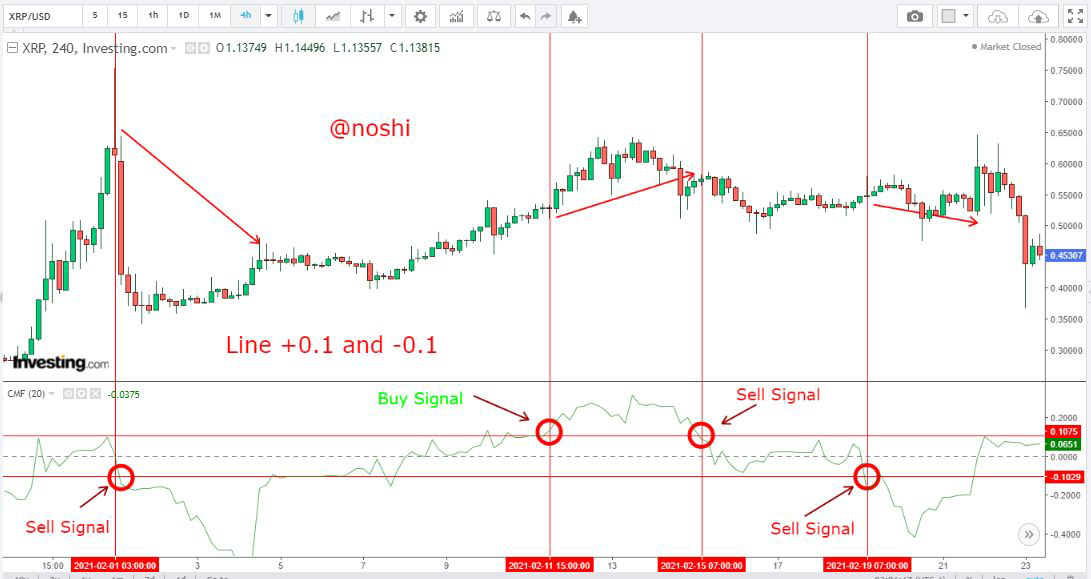
<center><sub> Fig.17 | Screenshot form<sup> [Investing.com]( https://www.investing.com/charts/cryptocurrency-charts)</sup></sub></center>
Again, in the chart, at the right side you can see can the indicator line is about to cross + 0.1 line from top to bottom. It indicates the selling signal. And we can see that after this cross the trend of market is bearish as mentioned in the chart with aero. In this way, we can figure out several buying and selling signal in one chart using CMF indicator.

### Trade with crossover signal using +/-0.2
I chose TRX/USD pair at 4h time period, for finding the buy and sell opportunity. In this chart, you can see at the bottom in the indicator line. I draw two horizontal line at +/-0.2 for finding the crossovers to determine the buying and selling opportunities.
Next, In the chart, at the left side of chart, you can see the indicator line cross +0.2 line from bottom to top. It indicates the Buy Signal. And we can see that after this cross the trend of market is Bullish as mentioned in the chart with aero.
In the chart, at the Middle of chart, you can see can the indicator line cross +0.2 line from top to bottom. It indicates the sell signal. And we can see that after this cross the trend of market is bearish as mentioned in the chart with aero.
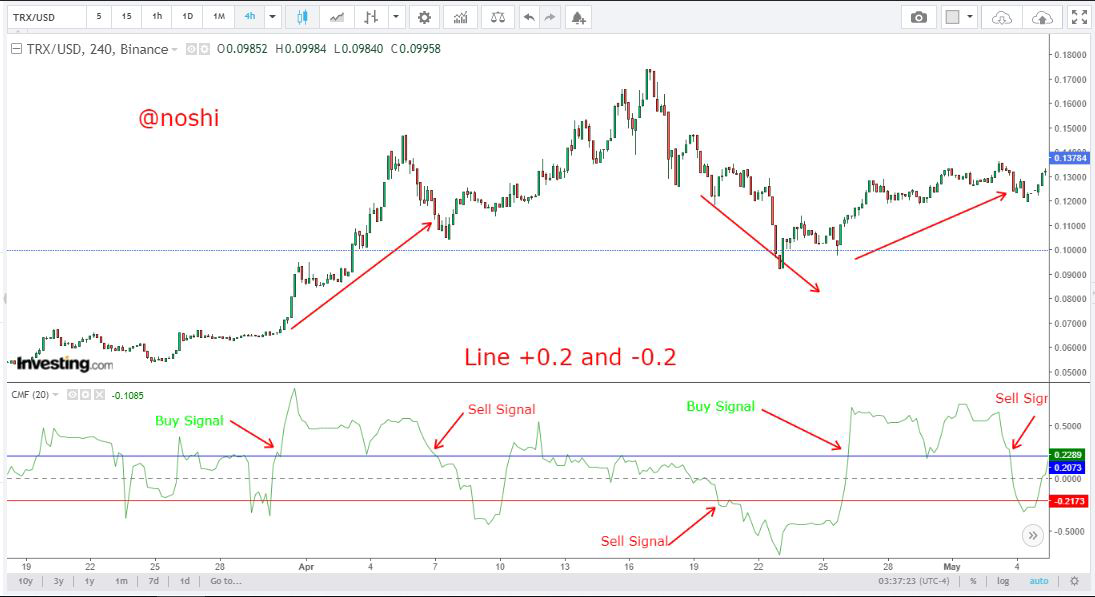
<center><sub> Fig.18 | Screenshot form<sup> [Investing.com]( https://www.investing.com/charts/cryptocurrency-charts)</sup></sub></center>
Again, in the chart, at the right side you can see can the indicator line is about to cross + 0.1 line from bottom to top. It indicates the Buying signal. And we can see that after this cross the trend of market is Bullish as mentioned in the chart with aero. At the extreme right side, the line cross +0.2 line from top to bottom, I indicates the sell signal. In this way, we can figure out several buying and selling signal in one chart using CMF indicator.

<center>**Question no :5**</center>
## How to trade with divergence between the CMF and the price line? Does this trading strategy produce false signals? (screenshot required)
Divergence is the scenario in which the results of chart and indicator has contradiction. When chart candles and Indicator lines are moving is opposite directions then it considered to be divergence zone. According the requirement of question, I find the divergence using the CMF indicator.
## Bullish Divergence
In the chart, I select the TRX/USD pair at the time period setting of 2H. In this chart, the movement of price in chart is moving downward. It indicates the downtrend of market. As you can see in the figure. But look at the indicator line. It is moving up. This is divergence that indicates the sensitivity of market trend.
Chart says the oversold of asset. And market trend is about to change from bearish to bullish according to chart. But indicator already indicates the bullish trend. It means that, the market trend reversal is ready. So, trade is possible in this bullish divergence. **I place the buy entry at $0.08533. Stop loss set at $0.08156 due to minor support level and Take profit level is $0.08910** I set the **Risk Reward (1:1). In this way, we can trade on divergence of CMF.
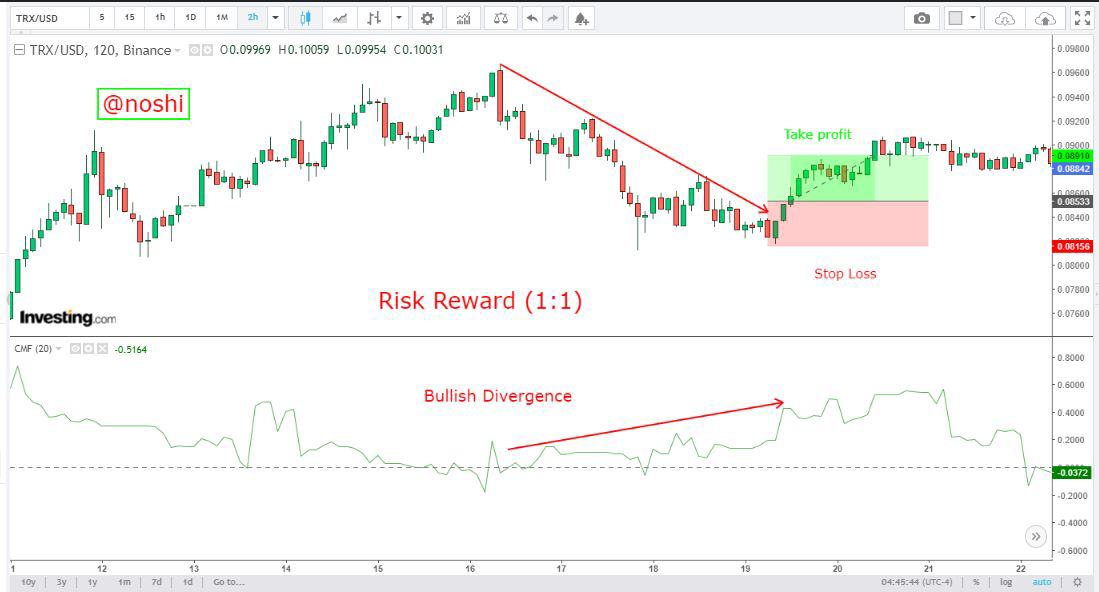
<center><sub> Fig.19 | Screenshot form<sup> [Investing.com]( https://www.investing.com/charts/cryptocurrency-charts)</sup></sub></center>
## Bearish Divergence
In the chart, I select the BNB/USD pair at the time period setting of 4H. In this chart, the movement of price in chart is moving upward. It indicates the Uptrend of market. As you can see in the figure. But look at the indicator line. It is moving down. This is the bearish divergence that indicates the sensitivity of market trend.
Chart says the overbought of asset. And market trend is about to change from bullish to bearish according to chart. But indicator already indicates the bearish trend. It means that, the market trend reversal is ready. So, trade is possible in this bearish divergence. **I place the sell entry at $655.02. Stop loss set at $682 due resistance level and Take profit level is $618.31** I set the **Risk/Reward (1.35)**. In this way, we can trade on bearish divergence of CMF.
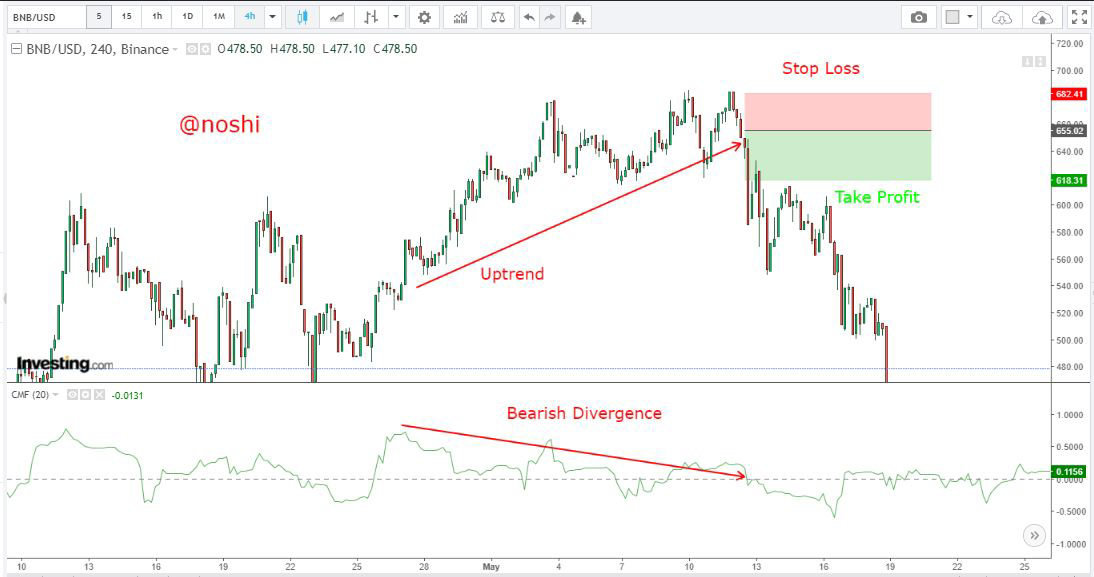
<center><sub> Fig.20 | Screenshot form<sup> [Investing.com]( https://www.investing.com/charts/cryptocurrency-charts)</sup></sub></center>

<center>**Conclusion**</center>
The Chaikin Money flow indicator is volume-based indicator, that helps the traders to determine the buying and selling pressure in market using the amount of money flow in market. Market trend is also determined using money flow in market. Traders place buy and sell order after observing the indicator line placement.
This indicator alone is use to figure out the false buy and selling signals. This is done by using the CMF line numbers. Most of the of the time, these numbers of lies between then 0.1 and 0.15, the values are both negative and positive. It depends on the volatility of particular security. False signals are pointed using these numbers.
After figure out the false signals, trader use this indicator for placing the buy and sell orders. When the indicator line crosses the limit line form bottom to top, then traders place order. On contrary when indicator line crosses the bottom limit line form top to bottom, then trader place sell order. Trader take profit, when this opposite cross takes place after few days or weeks according to our trading strategy.
***

***
## Cc:
## Professor: @kouba01
Author: @noshi
***
</div>