## Hello Everyone,
<div class="text-justify"> I must admit, I'm really having fun going through the various lectures in cryptoacademy. I've learnt a whole lot of things and I really hope to keep my momentum going. Today, I'm writing this post as my solutions to the assignment given by Professor @reddileep on the Heikin-Ashi trading strategy.
### Define Heikin-Ashi Technique In Your Own Words:
__________
Developed and designed by a Japanese man, Munehisa Homma in the years of 1700s, the Heikin-Ashi strategy of trading is one of the most interesting options to use in place of the regular Japanese candlesticks charts/trend. It is very useful and can be used by swing traders, day traders, etc in order to attain some of the best results in forex trading. The word **"Heikin"** comes from a Japanese word which means **"average"** and **"Ashi"** means **"bar"**, hence **"Average bars/candles"**. As explicitly discussed in Prof @reddileep's lecture, the Heikin-Ashi technique is a bit more simpler and quite easy to analyze as compared to other traditional Japanese candlesticks charts.
The Heikin-Ashi candlesticks charts are easier to read and analyze because they employ average market price values and not actual prices, thus, reducing the level of **"market noise"** on the charts. This trading technique helps users/traders to beware of when not to trade, continue trade, or pause their trade, thus, avoiding many losses and also reaping the best profits by informing them of market trends, including possible reversals. The trend/nature of the Heikin-Ashi candlesticks are such that every candle price are considered based on the four features of the previous candlestick.ie, high,low, open and close of the previous candle. The technique uses the averages of two or more of these features to determine the nature of the next candlestick, by using a range of equations/formulas called the Heikin-Ashi formulas.
### Make Your Own Research And Differentiate Between The Heikin-Ashi Charts And The Traditional Candlesticks Charts(Screenshots Required From Both Chart Patterns):
_____________
Generally, both types of charts, ie Heikin-Ashi Charts and Regular Candlesticks Charts look very similar to one another. However, there are a number of characteristics that differentiate these two.
For example, one main difference between the two is that Heikin-Ashi Charts make use of the averages of the high, low, open and close values of candles to determine the nature/trend of succeeding candles. Due to the use of these averages, from the image below, you'll note that the opening of each candle starts almost at the 50% mark of the body of the previous candle.
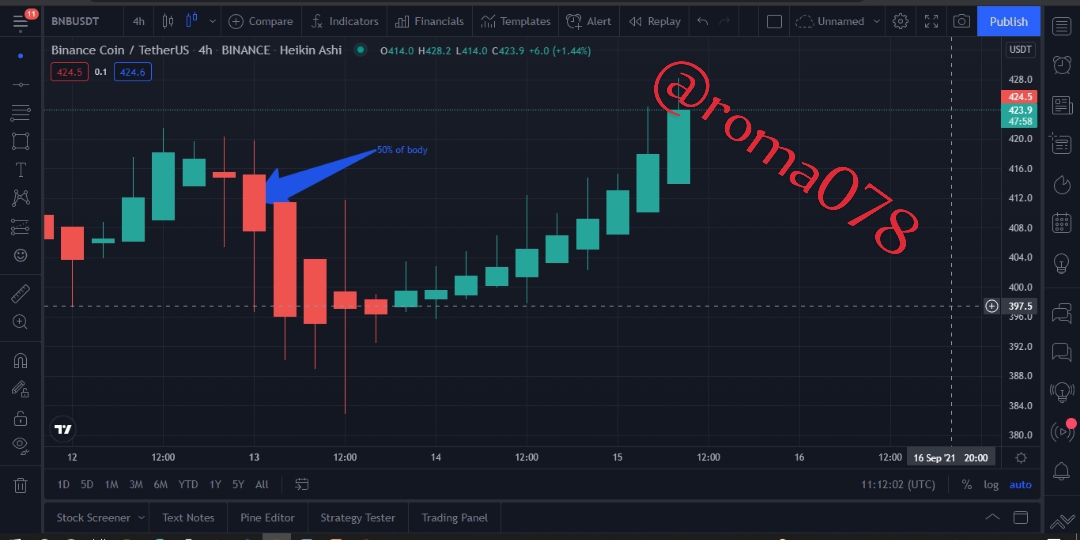_2.png)
<center><sub> Screen Shot from TradingView</sub></center>
As a result, for a Heikin-Ashi Chart, prices on the charts are not the exact prices of each candle, rather, it's the average price is f these candles.
Another difference is that in the Heikin-Ashi Charts, trends are much easier to identify unlike in a traditional candlestick chart. The reason being, in Heikin-Ashi Charts, candles showing a specific type of major trend are all of the same color. eg, a downtrend will be represented by a series of bearish/red candle sticks, while an uptrend will mostly be shown by a series of green candlesticks. However, in a regular candlestick pattern, a small red candle can be found in portions indicating obvious uptrends, and small green candles can also be spotted in portions of obvious downtrends. This can be seen in the images below
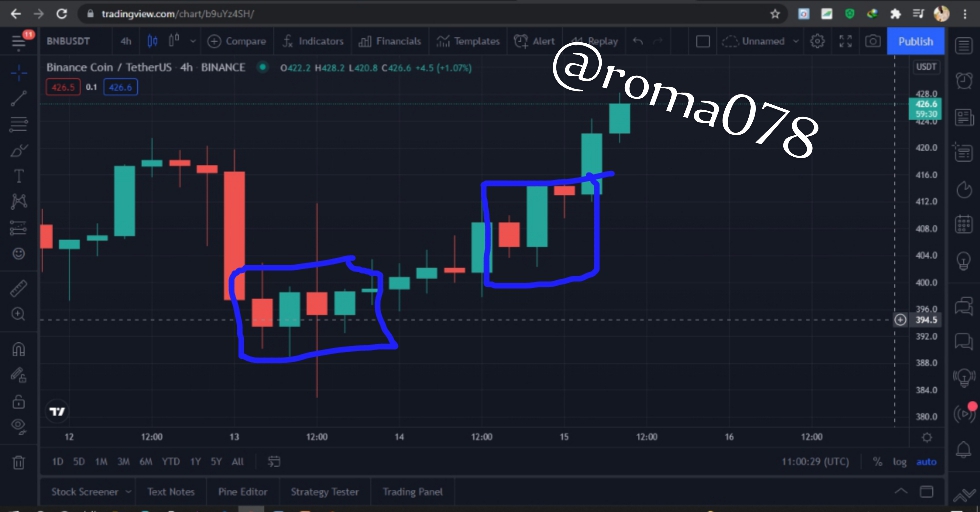
<center><sub> Screen Shots from TradingView</sub></center>
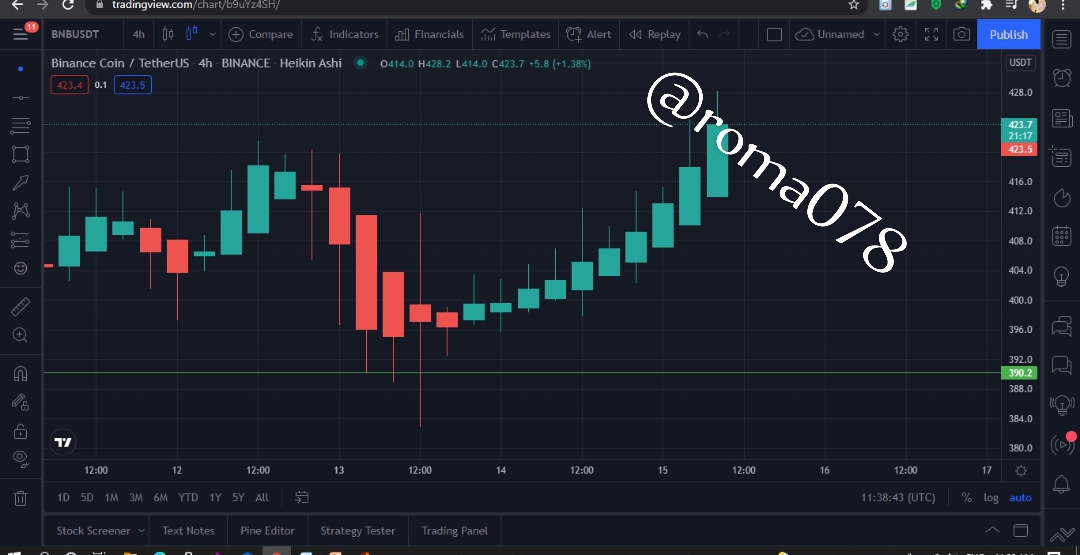
Also, in a strong uptrend in a Heikin-Ashi Chart, there are less/no lower wicks, and also less/no upper wicks in a very strong downtrend. This is different for uptrends and downtrends in a regular candlestick chart. This makes a Heikin-Ashi chart much smoother/fine as compared to a regular chart.
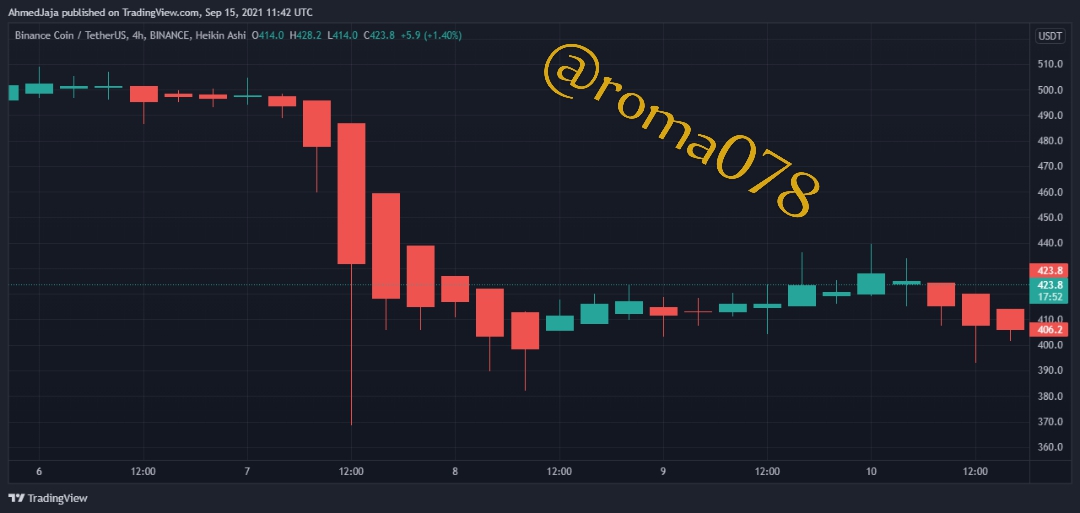
<center><sub> Screen Shots from TradingView</sub></center>
Heikin-Ashi Charts | Traditional candlestick chart
----------------- | ---------------
Nature of trends are derived by calculations | Does not involve calculations
Uses information from previous candle | Does not require information from previous candle
Candle starts at the middle of the body of previous candle | Current candle starts at the close of previous candle
Has price gaps | Have no price gaps
### Explain The Heikin-Ashi Formulae(In Addition To Simply Stating The Formula, You Should Provide Clear Explanations About The Calculation):
__________
The Heikin-Ashi candlesticks utilizes four different types of features.ie;
* Open
* Close
* High
* Low
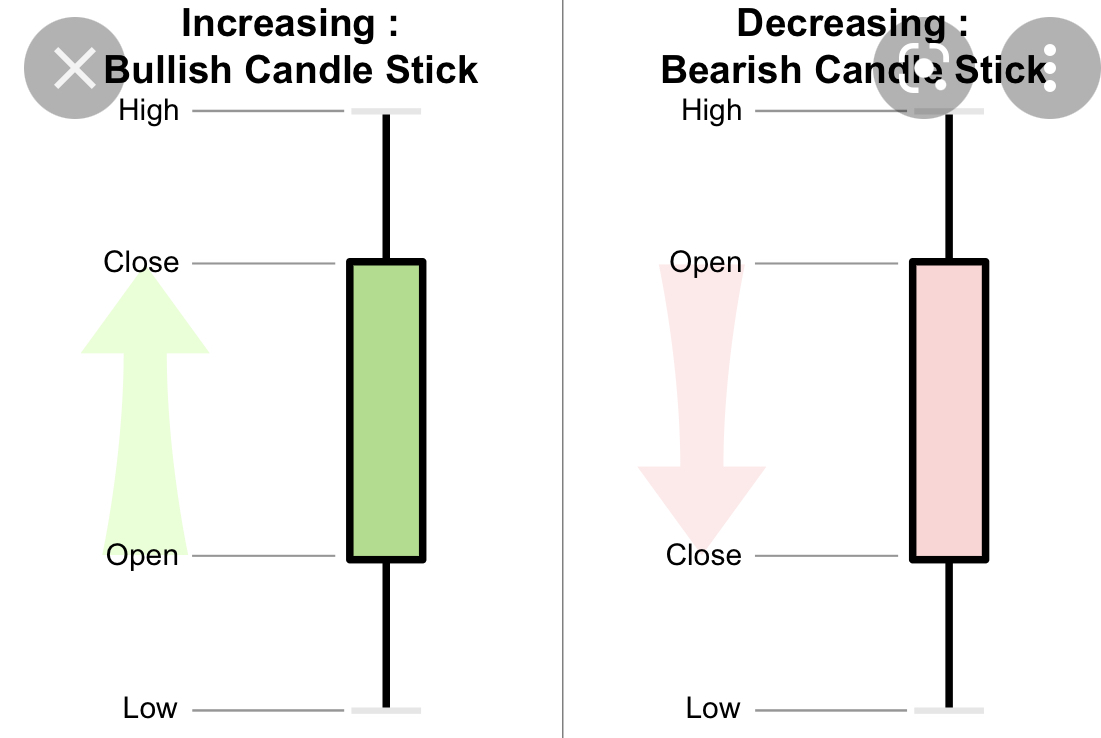
[Google](https://www.google.com/imgres?imgurl=https%3A%2F%2Fupload.wikimedia.org%2Fwikipedia%2Fcommons%2Fe%2Fea%2FCandlestick_chart_scheme_03-en.svg&imgrefurl=https%3A%2F%2Fcommons.wikimedia.org%2Fwiki%2FFile%3ACandlestick_chart_scheme_03-en.svg&tbnid=JKMUjNKcIIPDMM&vet=1&docid=zbcLhmdUfgXeYM&w=1500&h=1000&itg=1&hl=en&source=sh%2Fx%2Fim)[License details](https://creativecommons.org/licenses/by-sa/3.0/)
### Calculating The Open Of A Candlestick:
To determine the opening of a candle in a Heikin-Ashi Chart, add the opening and the closing values of the previous candle together and divide by two. For example, consider the image below.
_2.png)
<center><sub> Screen Shot from TradingView</sub></center>
From the image, it can be seen that the previous candle has:
Opening= USDT415.3
Closing= USDT407.7
This means, Opening of current candle= (415.3+407.7)/2 = USDT 411.5
### Calculating The Close Of A Candlestick:
To determine the close of a candle in a Heikin-Ashi Chart, add the open, close, high and low of the current candle in the regular Japanese candlesticks chart, and divide by 4. Considering the screenshots below,
High=402.9 USDT
Open=397.7 USDT
Close=393.6 USDT
Low=390.2 USDT
This means, Close of current candle=(402.9+397.7+393.6+390.2)/4 = 396.1 USDT
_1.png)
<center><sub> Regular Candlesticks Chart</sub></center>
_1.png)<center><sub>HA Chart</sub></center>
<center><sub> Screen Shots from TradingView</sub></center>
#### Calculating The High Of A Candlestick:
The high of a Heikin-Ashi candle is the highest/maximum value among the values of high, open and close of the current candle in a corresponding regular candlestick chart. Considering the following screenshot, it can be seen the highest value among the high, open and close of the current regular candle is 402.9 USDT.
_1.png)
<center><sub> Screen Shot from TradingView</sub></center>
#### Calculating The Low Of A Candlestick:
The low of a Heikin-Ashi candlestick is the lowest value among the low, open and close values of the current candle in the corresponding traditional candlestick chart. In the image below, the low of the current HA candle is USDT 390.2, which apparently, is the minimum of the corresponding low, open and close candle in the traditional candlestick chart.
_2.png)
<center><sub> Regular Candlesticks Chart</sub></center>
_2.png)
<center><sub>HA Chart</sub></center>
<center><sub> Screen Shot from TradingView</sub></center>
### Graphically Explain Trends And Buying Opportunities Through Heikin-Ashi Candles.
_______
As stated earlier, the Heikin-Ashi Candlesticks Charts make trends much easier to identify and read by ensuring that characteristics that determine these trends are more prominent and obscure.
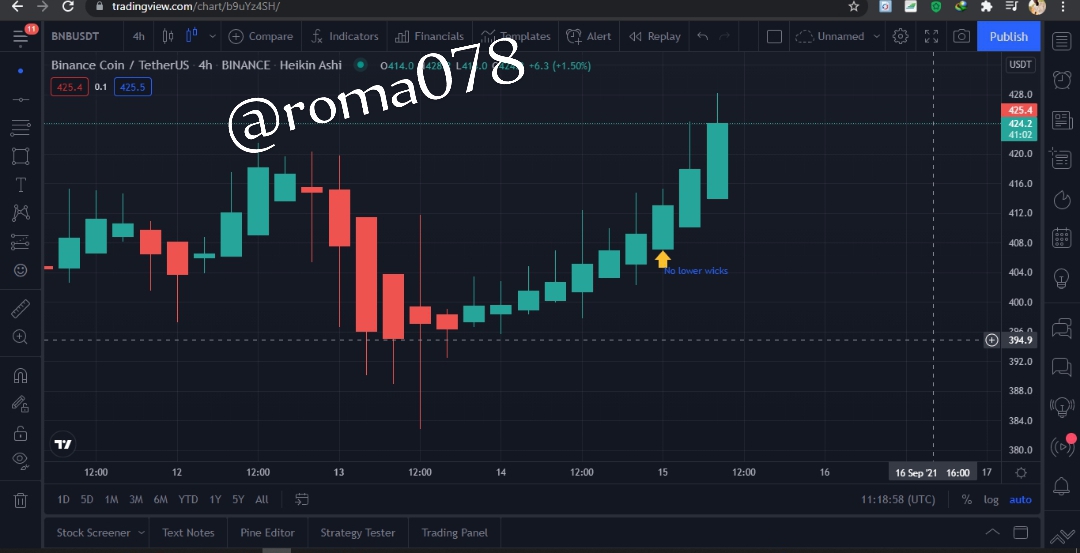
#### Uptrend:
For an uptrend, it is usually characterized by a series of green candlesticks. A prominent uptrend in a Heikin-Ashi chart are mostly marked by a strong/large bullish candle. Candles in an uptrend usually do not have a lower wick.
_2.png)
<center><sub> Screen Shot from TradingView</sub></center>
### Downtrend:
For a downtrend in a Heikin-Ashi chart, it is usually characterized by a series of red candlesticks. A strong downtrend in a Heikin-Ashi chart are marked by large/strong bearish candles. These candles in a Heikin-Ashi downtrend do not usually have an upper wick above the body.
<center><sub> Screen Shot from TradingView</sub></center>
#### Ranging and Indecision Trends:
Ranging Trends in a Heikin-Ashi Chart are characterized by a series smaller candles(usually of red and green colors) in a row that have wicks on both upper and lower of the body. At this stage, it is unpredictable and neither buyers or sellers have an upper hand. If few of these smaller candles are seen within a prominent uptrend or downtrend, this indicates indecision in the market as seen in the images below.
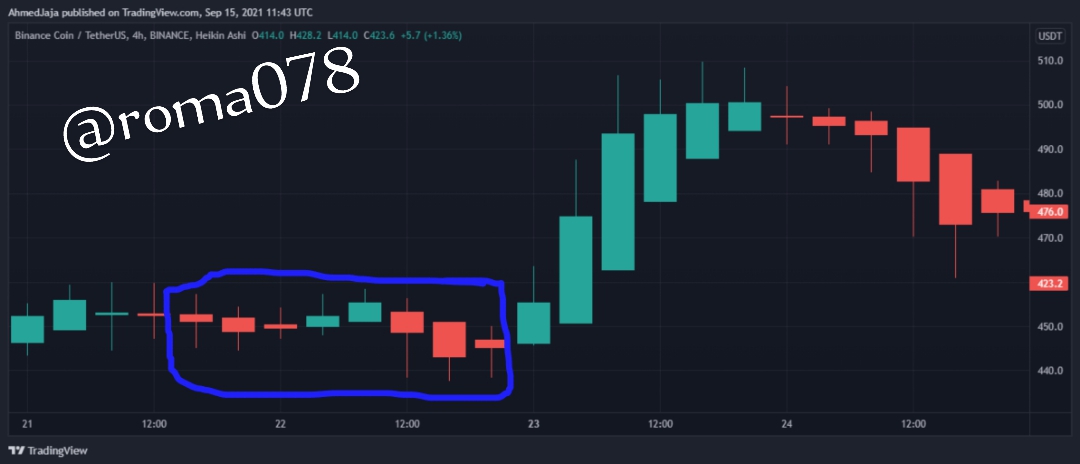
<center><sub> Screen Shot from TradingView</sub></center>
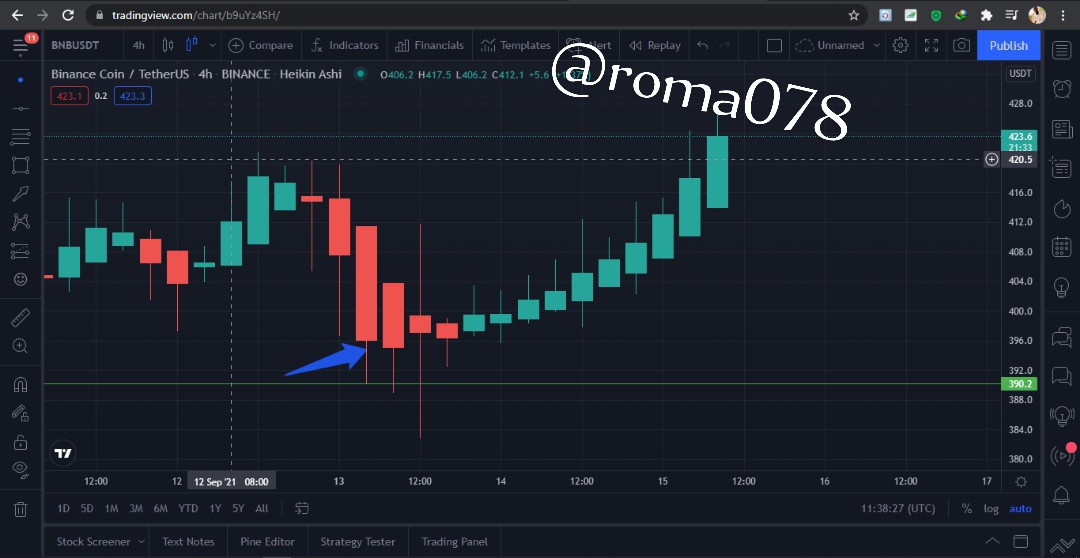
#### Buying Opportunity:
To identify a buying opportunity in a Heikin-Ashi chart, we wait until we have an indecision in the market after a downtrend. When there's indecision, we then wait for a strong signal of an uptrend(ie; strong bullish candle with no lower wick). When spotted, we can then enter into trade on the close of the candle.
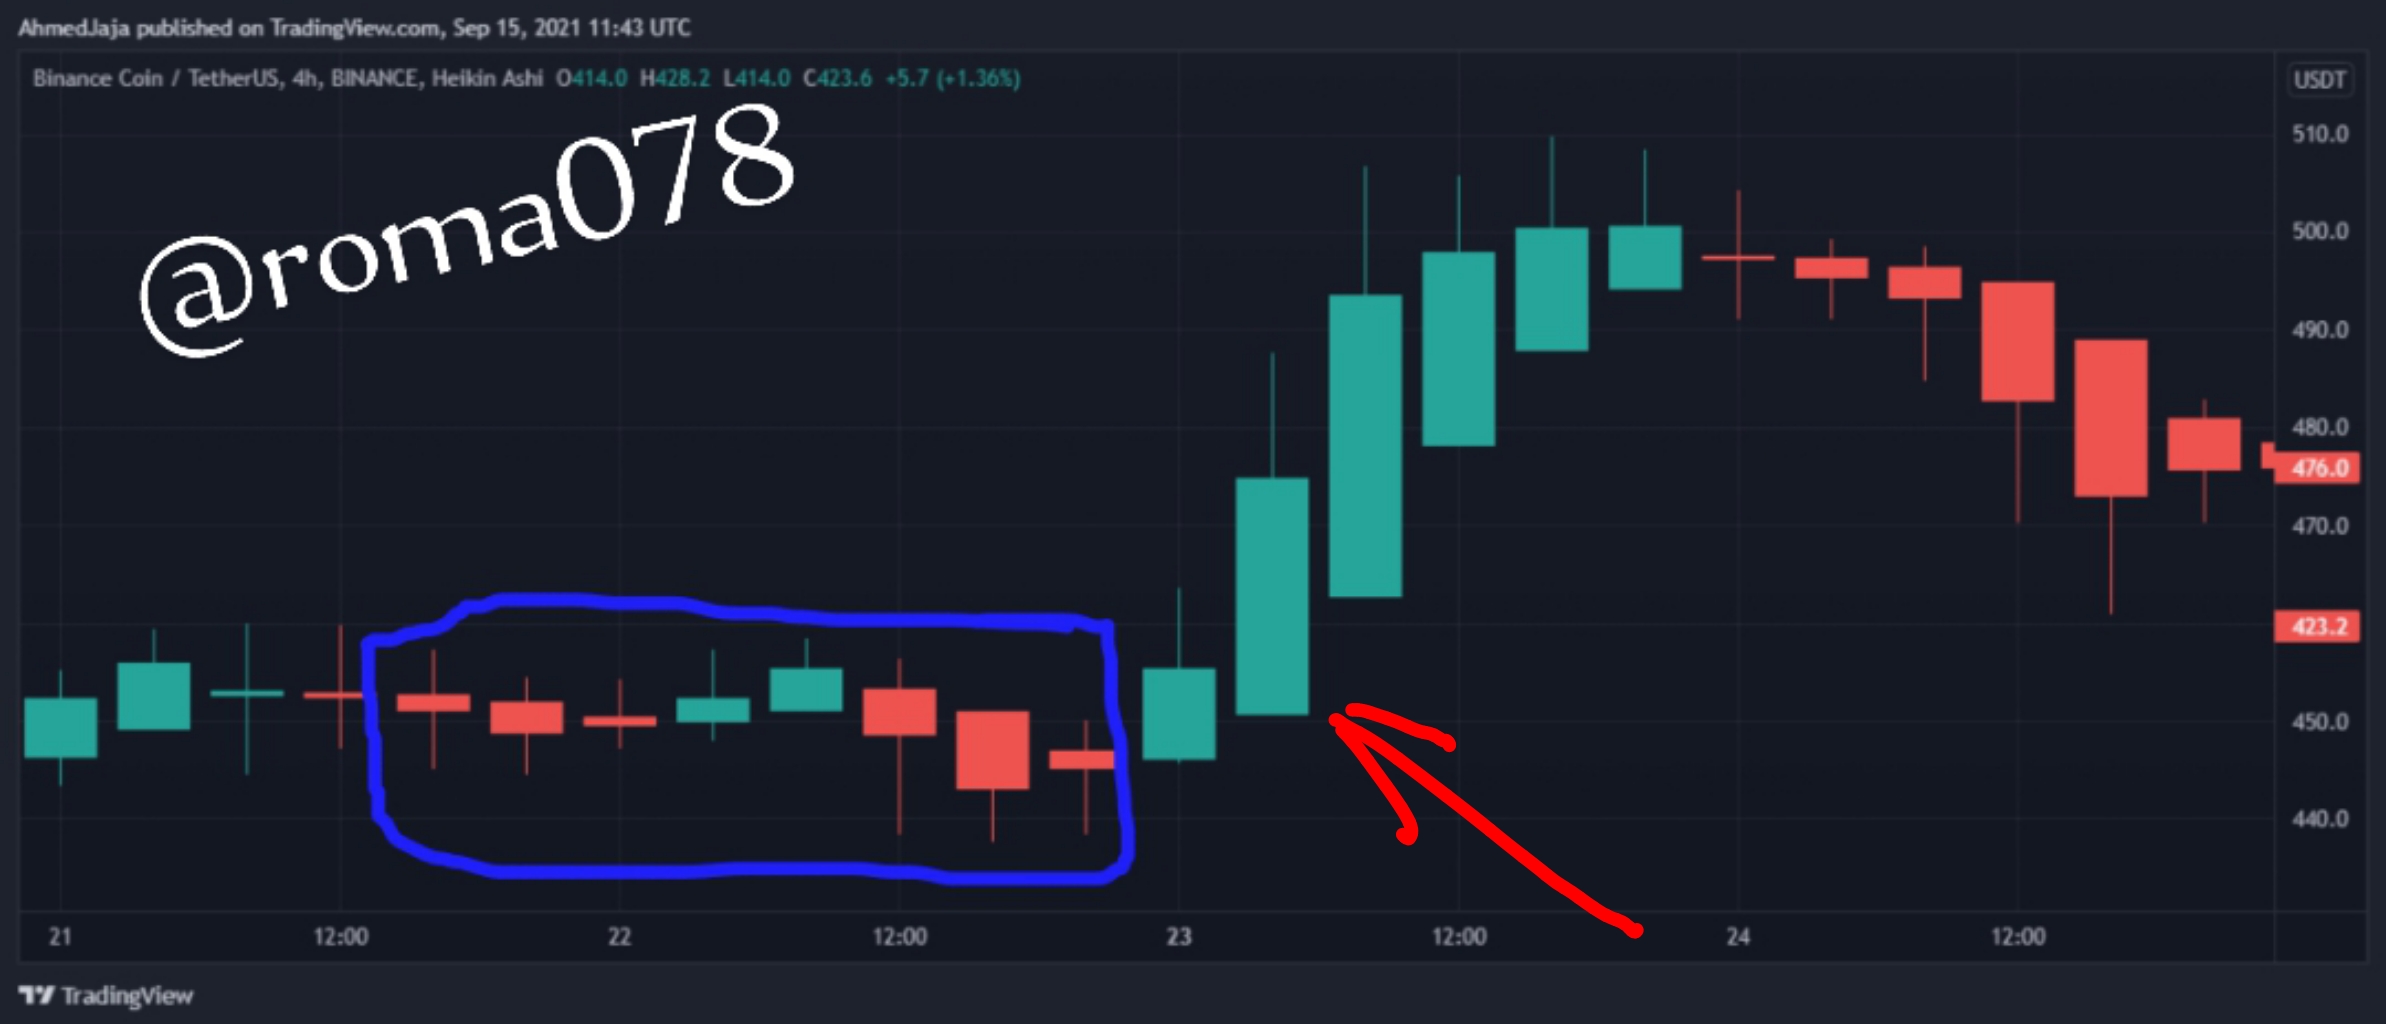
<center><sub> Screen Shot from TradingView</sub></center>
### Is It Possible To Transact Only With Signals Received Using The Heikin-Ashi Technique? Explain Reasons For Your Answer:
________
Even though the Heikin-Ashi technique has a lot of trading advantages, it is still not completely flawless. Just like all other techniques, it also has its shortcomings.
For example, the Heikin-Ashi technique is only employable for long-term trading, hence, very difficult to be used for transactions in shorter period trading like in intraday trading/scalpers.
Another issue about using only HA technique is that, it takes longer time to setup a trade/trend. The reason being it's use of averages of period values. This is not good for day traders. For swing traders, they can easily use this technique often as they can allow their trades more time without harm.
The absence of price gaps in Heikin-Ashi Charts also makes it difficult for traders to accurately determine the direction of prices, thus, making it more difficult to set entry levels and stop-losses.
Thus, depending on my type of trade, otherwise, I'd advice not to use only HA technique for transactions.
### By Using A Demo Account, Perform Both Buy And Sell Orders Using Heikin-Ashi+55EMA+ 21EMA
______
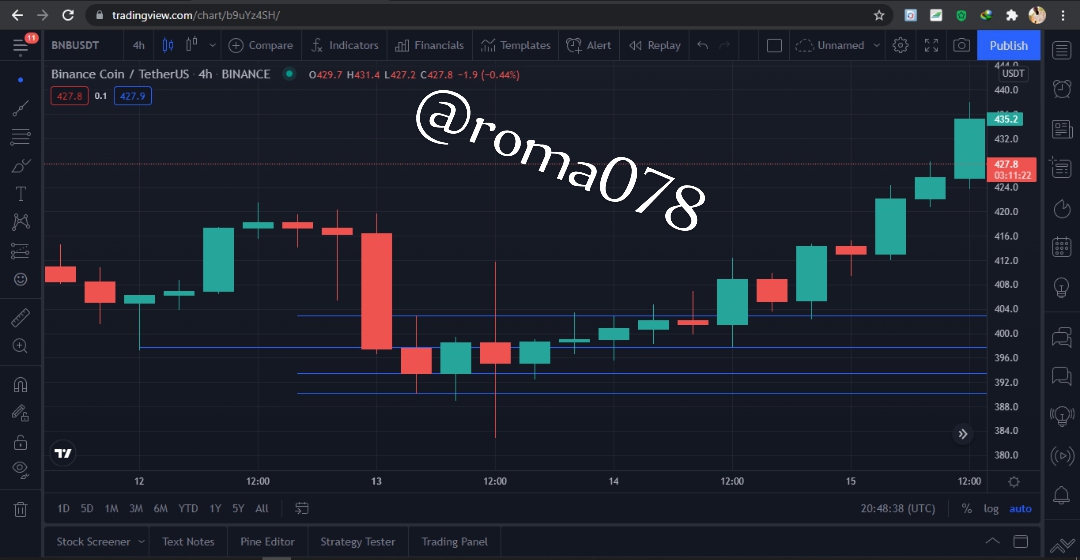
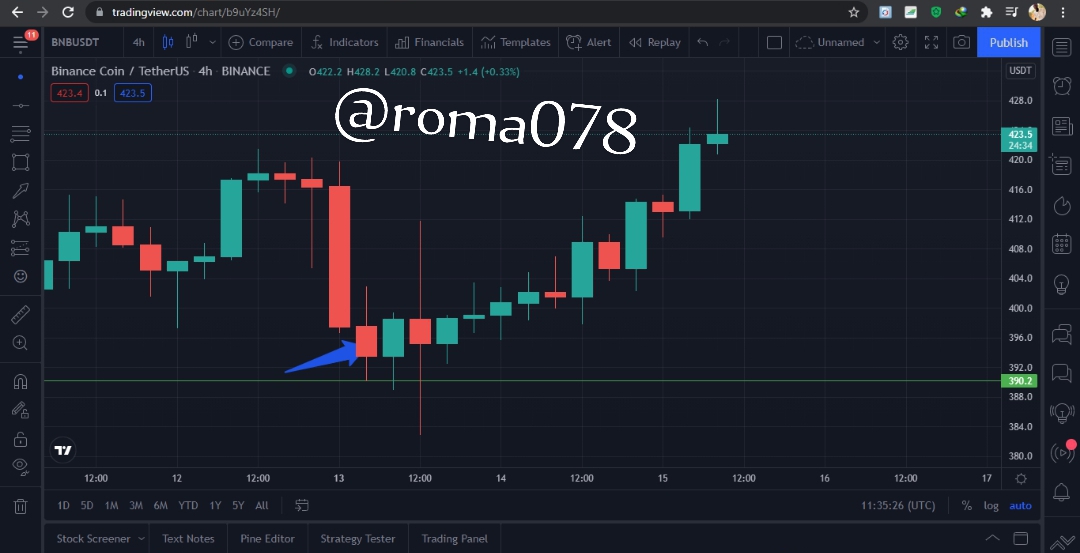
#### Buying In Trade:
The image below shows a Binance coin/ Tether US market chart. From the chart, it can be seen that there's a range of indecision trend, after which there's a steep uptrend above the 55 and 21 EMA. There's a strong bullish candle after the indecision and above the 55EMA. You can choose to enter into trade at this point. However, to be on a much safer side, I will wait until another strong bullish candle appears, above the 21EMA as shown below.
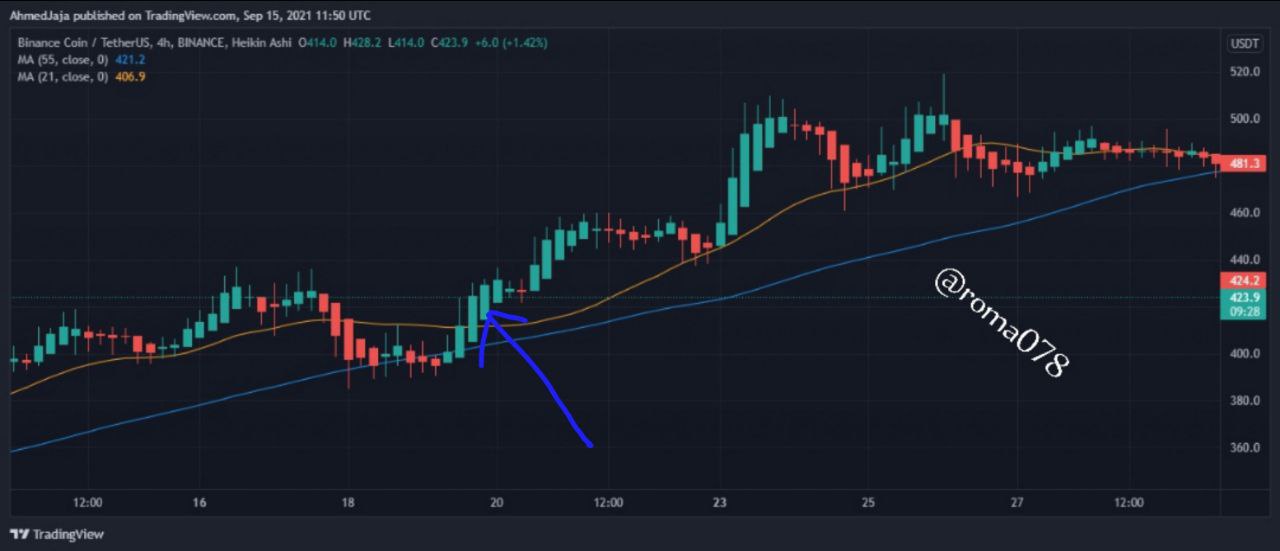
<center><sub> Screen Shot from TradingView</sub></center>
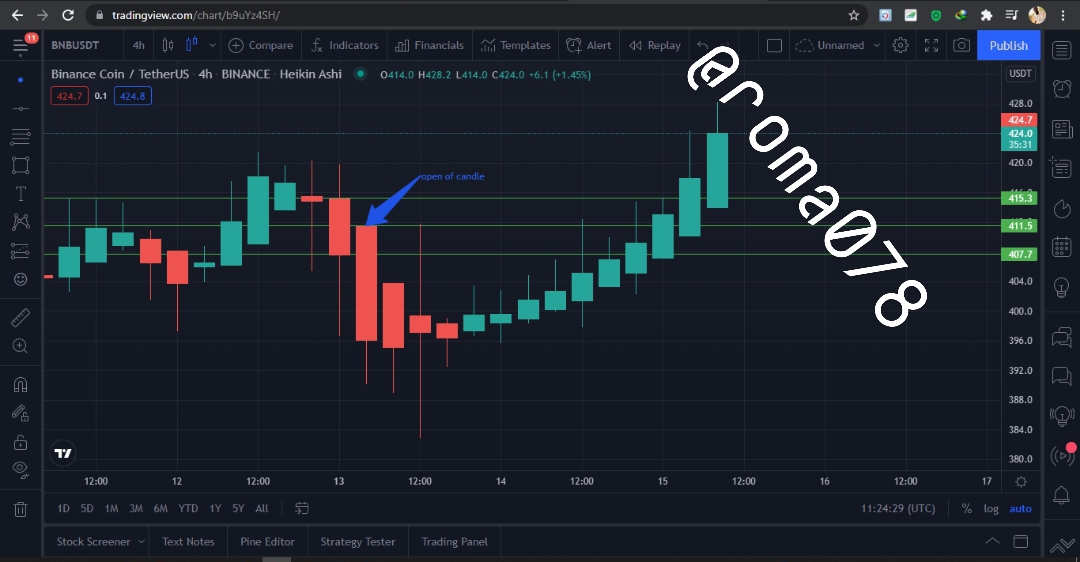
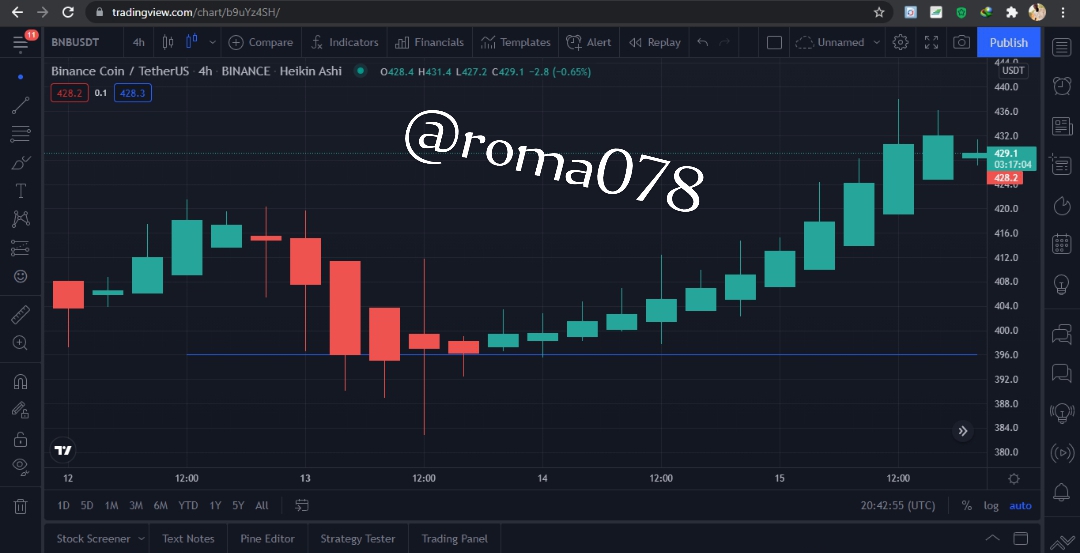
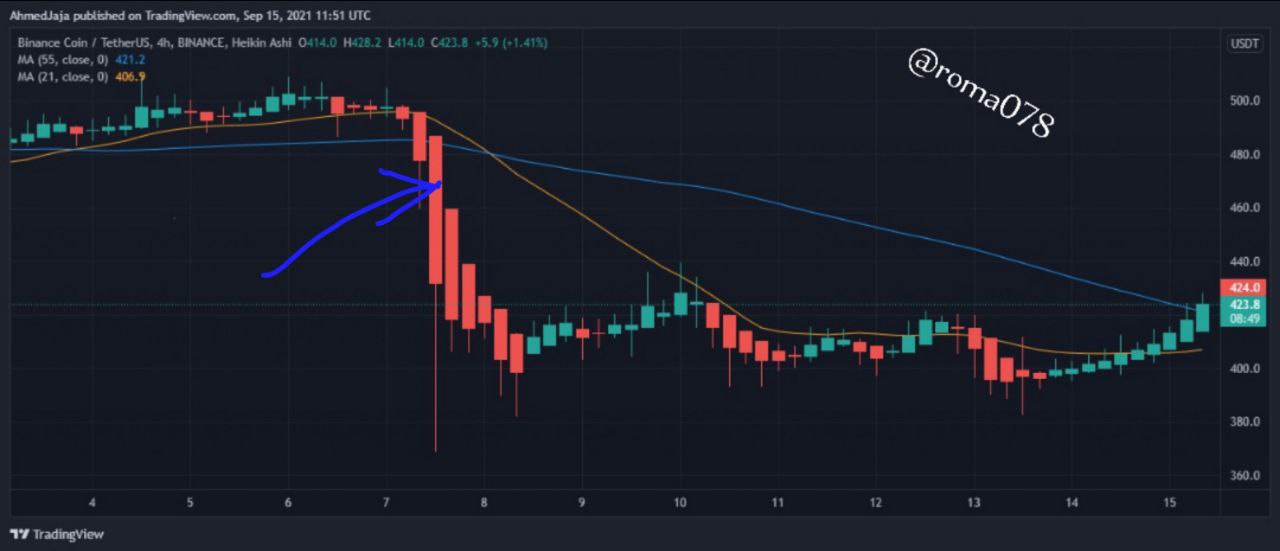
#### Selling In Trade:
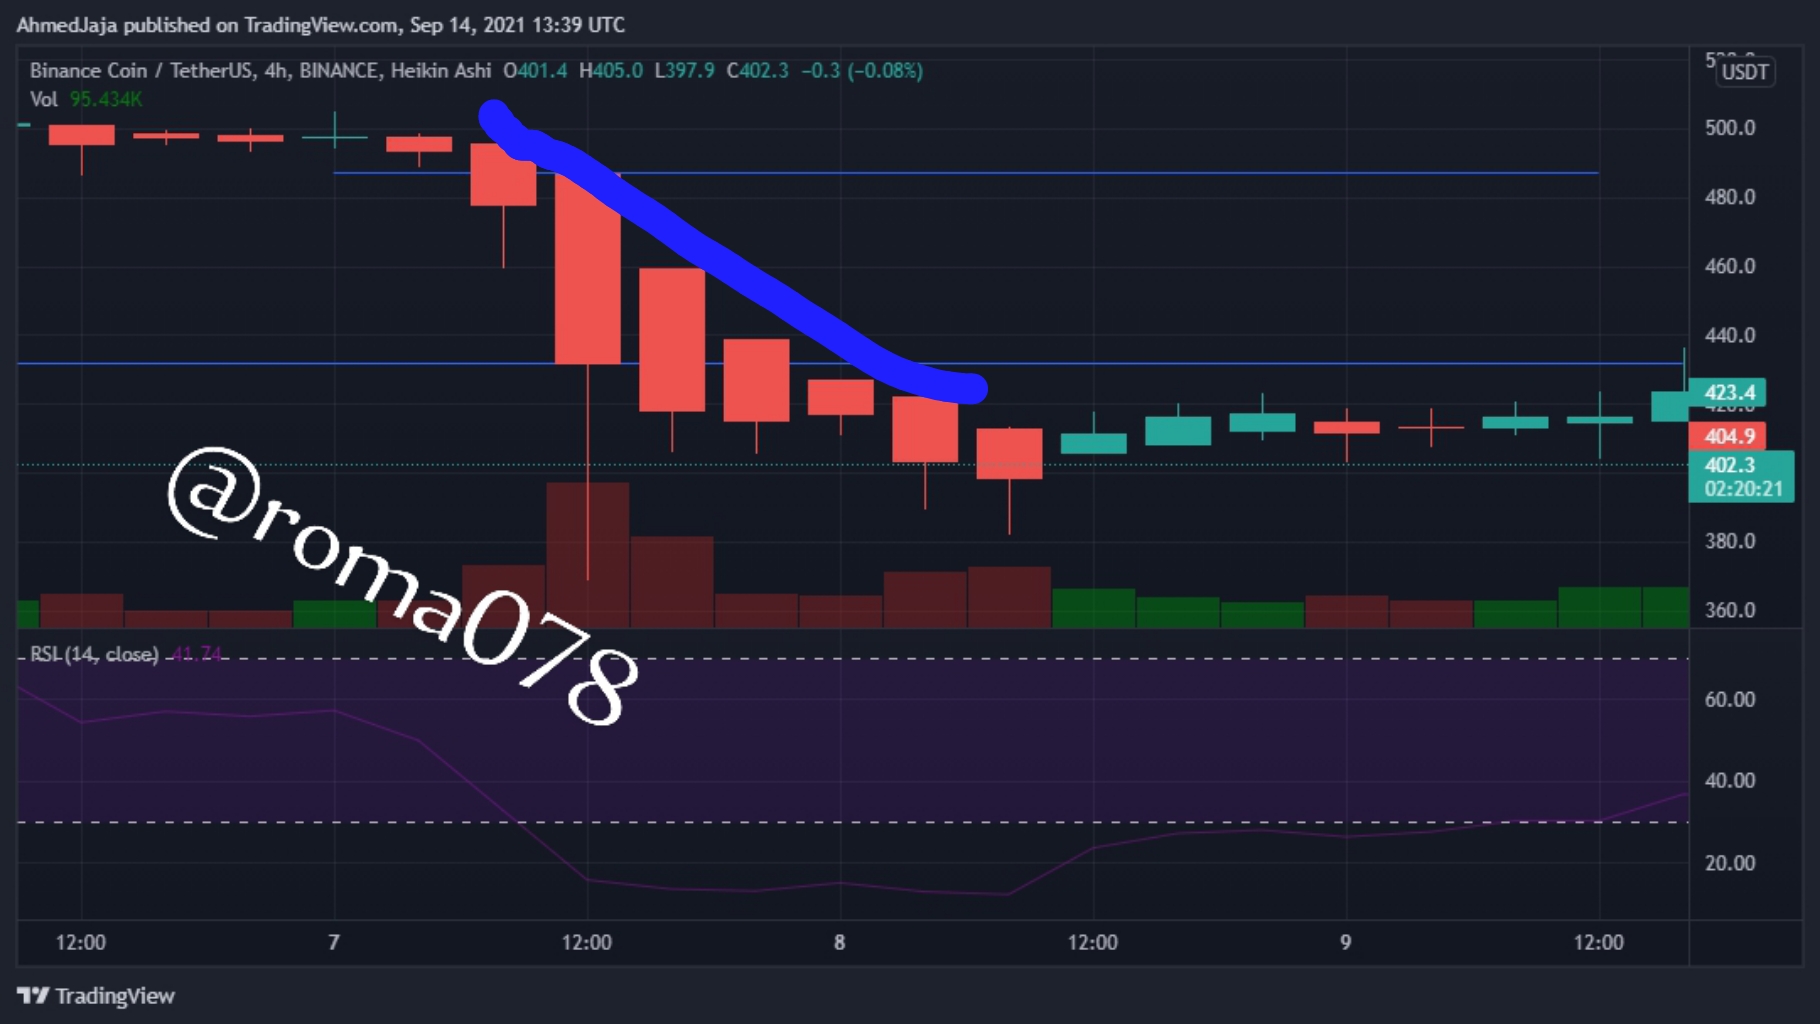
The image below shows a steep downtrend in the chart of a Binance coin/Tether US market chart. There is a strong bearish candle after the ranging market (indecision). This is a sufficient signal of a downtrend. However, one can wait another stronger bearish signal appears, majorly below both the 55 and 21 EMA indicators. This candle is s shown by the arrow in the screenshot below. I can sell/leave trade at the opening of this candle.
<center><sub> Screen Shot from TradingView</sub></center>
<center>**CONCLUSION**</center>
Heikin-Ashi Candlesticks Charts are important for forex traders of all types. This trading strategy makes use of averages of price values to display trends in a market. The use of averages help filter out market noise, hence making trends easier to identify and analyze. The HA technique is different from the traditional candlestick chart patterns in many ways. Despite its simplicity, the HA technique also has its pros and cons. Though it may not be the ideal trading strategy for short period traders, it is exceptionally good in giving the general insights on when to enter or exit a market.
Thank you.
</div>