**What is a metabolic flux?** In essence it is the rate of flow of material through a metabolic pathway in a living organism.
**Why measure metabolic fluxes?** Chemical engineers focus on measuring metabolic fluxes because this provides a quantitative understanding of metabolism and its regulation (control) *in vivo*, particularly when combined with perturbations (e.g. environmental changes, or genetic changes). This may assist in metabolic pathway discovery (i.e. discovery of new routes of metabolism that were not previously recognized). Quantification of flux changes in a metabolic pathway and the yields of end-products of the pathway in organisms that have been genetically modified in specific ways (e.g. transgenic organisms or mutants) may inform the investigator about ways to enhance these end-product yields. This has an immense number of applications in the field of "metabolic engineering", where chemical engineers tweak the genomes of industrially important microorganisms to optimize end-product synthesis and yield of valuable biomolecules. In addition, metabolic flux analysis may assist in identifying interactions among components of metabolic networks *in vivo* -- interactions that might not be recognized by studying the individual components in isolation (e.g. single enzymes studied in test-tube reactions).
**Metabolic engineering defined.** Metabolic engineering (ME) is defined as "the directed improvement of cellular properties through the modification of specific biochemical reactions or the introduction of new ones, with the use of recombinant DNA technology" (Stephanopoulos (1999)). This was written by Stephanopoulos in the very first article of the very first volume of the journal "Metabolc Engineering". This journal provides an important repository of information on metabolic engineering and metabolic flux analysis in industrially important microorganisms, and increasingly in plants, and in cellular systems relevant to the understanding of human physiology/biochemistry and diseases.
Examples of metabolic engineering of microorganisms for industrial uses published in the journal *Metabolic Engineering* in 2018 alone include:
- glycolate production in *Escherichia coli* (Deng et al. (2018))
- long chain alkane and alcohol production in *Escherichia coli* (Fatma et al. (2018))
- ethanol and biofuel production in cyanobacteria (Liang et al. (2018))
- monoterpene production in *Saccharomyces cerevisiae* (Peng et al. (2018))
- L-valine production in *Corynebacterium glutamicum* (Schwentner et al. (2018))
- L-valine production in *Saccharomyces cerevisiae* (Takpho et al. (2018))
- phenol production in *Pseudomonas taiwanensis* (Wynands et al. (2018))
This is by no means an exhaustive list.
Stephanopoulos (1999) continues ... "the essence of metabolic engineering is the quantification of metabolic fluxes and their control under *in vivo* conditions" ... "A key emphasis of metabolic engineering is the consideration of the whole system instead of its component parts." Increasingly, metabolic flux analysis is combined with metabolic modeling with the aid of computers.
Stephanopoulos, Aristidou and Nielsen published a book in 1998 entitled "Metabolic Engineering: Principles and Methodologies" (cited below) that represents an essential resource for anyone pursuing research in this field. Nielsen, the co-author of this book has been a pioneer in application of these principles and methodologies, and notes ((Nielsen et al. (2001)) that metabolic engineering is often a cyclic/iterative process. A genetic modification to an organism may be made in the "synthesis" phase, and the organism is then analyzed and metabolically characterized physiologically, including by metabolic flux analysis. The resulting data is then integrated and interpreted (often using computer simulation models). The outcomes of the initial genetic modifications (e.g. influence on product yields, adverse effects, unexpected outcomes) may then initiate further design modifications and a second round of genetic modifications (etc).
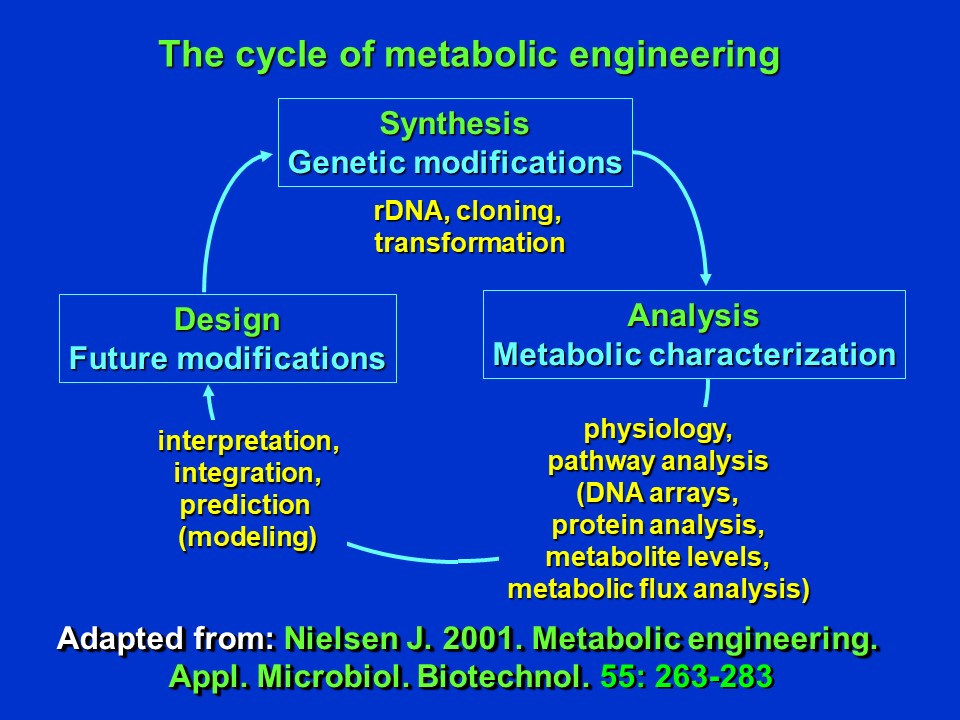
The cycle of metabolic engineering (adapted from Nielsen (2001)) (D. Rhodes)
Metabolic modeling with computers can assist in calculating fluxes and maximum yields, formulate testable hypotheses, design experiments, anticipate system responses to perturbations (e.g. further genetic manipulations), organize and quantitatively interpret complex data sets with many interacting variables, and provide alternative (sometimes counter-intuitive) explanations for experimental observations.
**So how are metabolic fluxes measured?** Most often this is done with the use of isotopic labeling, typically with stable isotope carbon-13 (<sup>13</sup>C) labeled precursors supplied to the living organism or cell culture. This methodology is critical for determining fluxes via metabolic cycles and quantifying flux-splits at metabolic branch points. In microbial systems in particular, this method is concerned with material and isotope balances, and often assumes constant fluxes in a metabolic steady-state. It relies on measurement of the isotope enrichment of intermediates or products derived from metabolism of the supplied <sup>13</sup>C labeled precursor(s) using nuclear magnetic resonance (NMR) or mass spectrometry (MS) (Wiechert (2001)). Initially, no information is needed about enzyme kinetics.
**An example of isotopic labeling: <sup>13</sup>C-pyruvate utilization in the citric acid cycle**. To illustrate the power of isotopic labeling to measure fluxes in central carbon metabolism, let's look at the citric acid cycle (discussed in my last post: [Citric Acid Cycle and Mitochondrial Electron Transport](https://steemit.com/steemstem/@davidrhodes124/citric-acid-cycle-and-mitochondrial-electron-transport)).
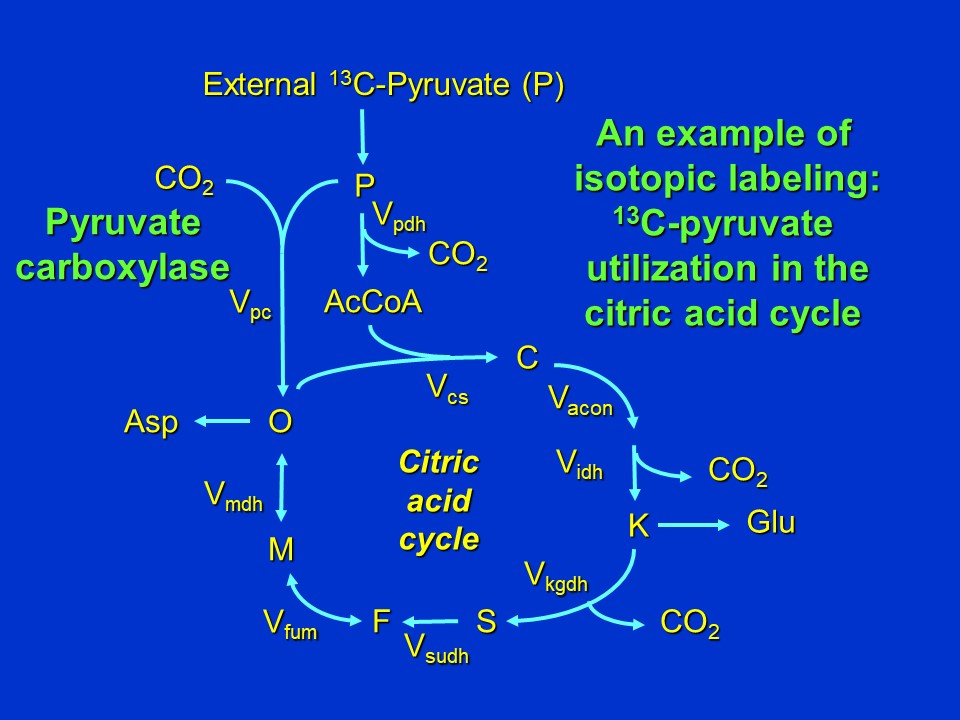
An example of isotopic labeling: <sup>13</sup>C-pyruvate utilization in the citric acid cycle (adapted from Stephanopoulos et al. (1998)) (D. Rhodes)
Abbreviations used: P = pyruvate, AcCoA = acetyl CoA, C = citrate, K = alpha-ketoglutarate (2-oxoglutarate), S = succinate, F = fumarate, M = malate, O = oxaloacetate, Asp = Aspartate, Glu = glutamate, V = reaction velocity (V<sub>subscripts</sub> are abbreviations of enzyme names: cs = citrate synthase, pdh = pyruvate dehydrogenase, acon = aconitase, idh = isocitrate dehydrogenase, kgdh = alpha-ketoglutarate dehydrogenase, sudh = succinate dehydrogenase, fum = fumarase, mdh = malate dehydrogenase, pc = pyruvate carboxylase).
In many microorganisms anaplerotic synthesis of oxaloacetate occurs via pyruvate carboxylase. Activity of this enzyme is required if any intermediates are removed from the cycle (for example, if oxaloacetate (O) is removed for aspartate (Asp) synthesis, or if alpha-ketoglutarate (K) is removed for glutamate (Glu) synthesis).
If positionally labeled <sup>13</sup>C-pyruvate is supplied to an organism with the citric acid pathway structure shown above, and if label is in the 2 position (see red dot in the following image), *and if there is no removal of oxaloacetate (O) or alpha-ketoglutarate (K) from the cycle for aspartate and glutamate synthesis*, we see that in the first turn of the cycle, citrate (C) and ketoglutarate (K) will become labeled in the 5 position, succinate (S) in the 4 position, and malate (M) and oxaloacetate (O) in either the 1 or 4 positions. The latter result is a consequence of fumarate (the intermediate between succinate and malate) being a symmetrical molecule.
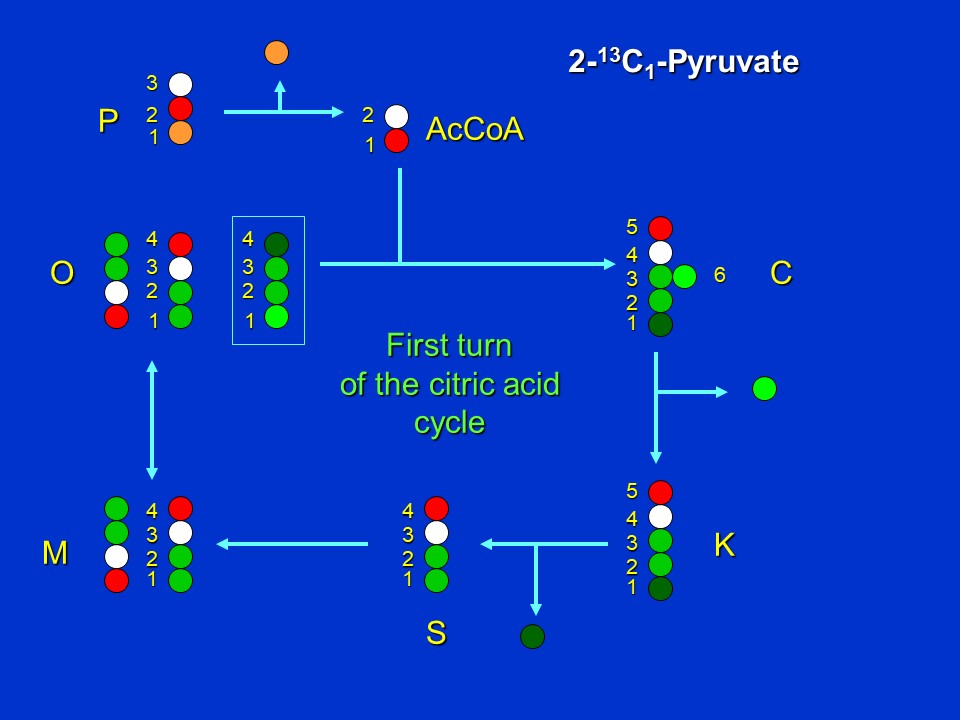
The first turn of the citric acid cycle when 2-<sup>13</sup>C-pyruvate (P2) is supplied (D. Rhodes)
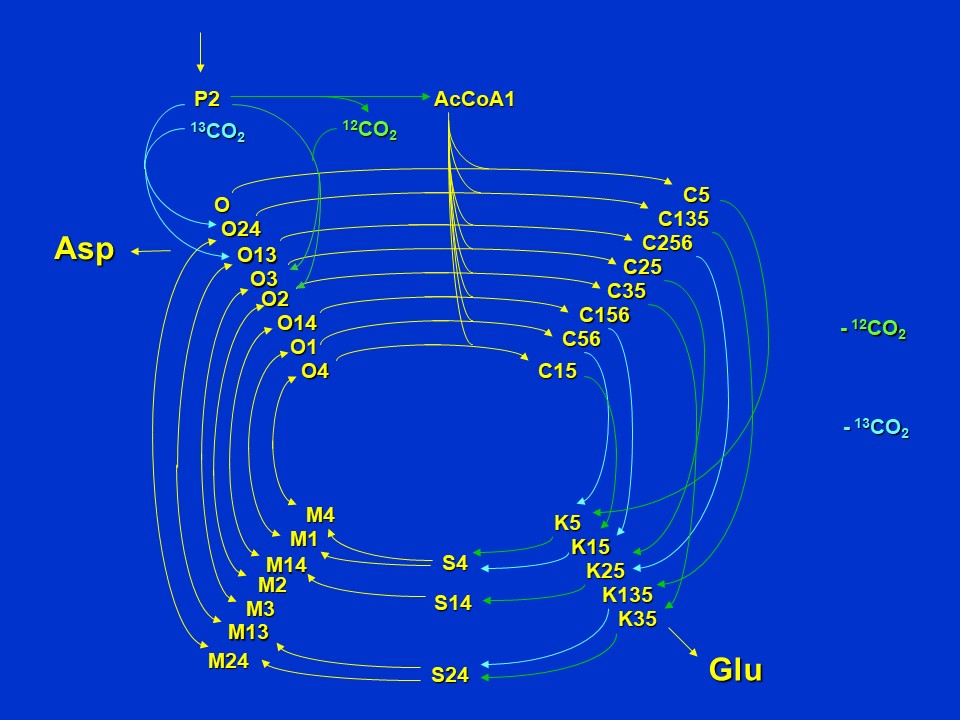
Extrapolating to further turns of the cycle, if <sup>13</sup>C-pyruvate is supplied to an organism with the citric acid pathway structure shown above, and if label is in the 2 position (abbreviated as P2), *and if there is no removal of oxaloacetate (O) or alpha-ketoglutarate (K) from the cycle for aspartate and glutamate synthesis*, we see that citrate eventually becomes labeled in the 5 and 6 (C56) positions and 1 and 5 (C15) positions, and ketoglutarate in the 1 and 5 (K15) and 5 (K5) positions. Malate and oxaloacetate achieve label only in the 1 and 4 positions (M1, M4, O1, O4).
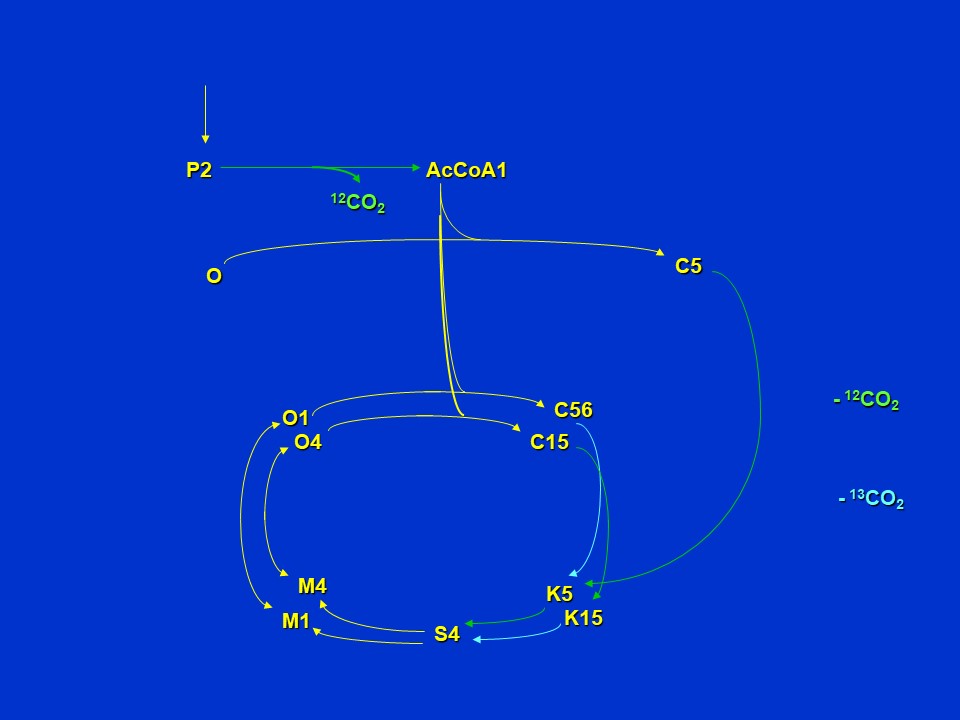
Subsequent turns of the citric acid cycle when 2-<sup>13</sup>C-pyruvate (P2) is supplied (D. Rhodes)
But now consider what happens if *oxalacetate and alpha-ketoglutarate are removed from the cycle for aspartate and glutamate synthesis*. Here anaplerotic synthesis of oxaloacetate (O) has to occur via the pyruvate carboxylase reaction to replenish intermediates removed from the cycle. If pyruvate carboxylase uses <sup>12</sup>CO<sub>2</sub> from the atmosphere or <sup>13</sup>CO<sub>2</sub> generated from supplied pyruvate respiration there will be different isotopomers of oxaloacetate (O) formed, which in turn will have consequences for the labeling patterns of citrate (C), ketoglutarate (K), glutamate (Glu), succinate (S), malate (M), oxaloacetate (O) and aspartate (Asp).
Labeling patterns of intermediates when cycle intermediates are removed for aspartate and glutamate synthesis (D. Rhodes)
Let's further consider the same scenarios of labeling of the intermediates when positionally labeled <sup>13</sup>C-pyruvate is supplied to an organism with label in the 3 position (see red dot in the following image). Again let's first assume *no removal of oxalacetate or alpha-ketoglutarate from the cycle for aspartate and glutamate synthesis*. We see that in the first turn of the cycle, citrate (C) and ketoglutarate (K) will become labeled in the 4 position, succinate (S) in the 3 position, and malate (M) and oxaloacetate (O) in either the 2 or 3 positions. The latter result is again the consequence of fumarate (the intermediate between succinate and malate) being a symmetrical molecule.

The first turn of the citric acid cycle when 3-<sup>13</sup>C-pyruvate (P3) is supplied (D. Rhodes)
Extrapolating to further turns of the cycle, if <sup>13</sup>C-pyruvate is supplied with label in the 3 position (P3), *and if there is no removal of oxaloacetate and alpha-ketoglutarate from the cycle for aspartate and glutamate synthesis*, we see that the number of isotopomers of pathway intermediates is greatly increased relative to those formed from pyruvate labeled in the 2 position (P2).
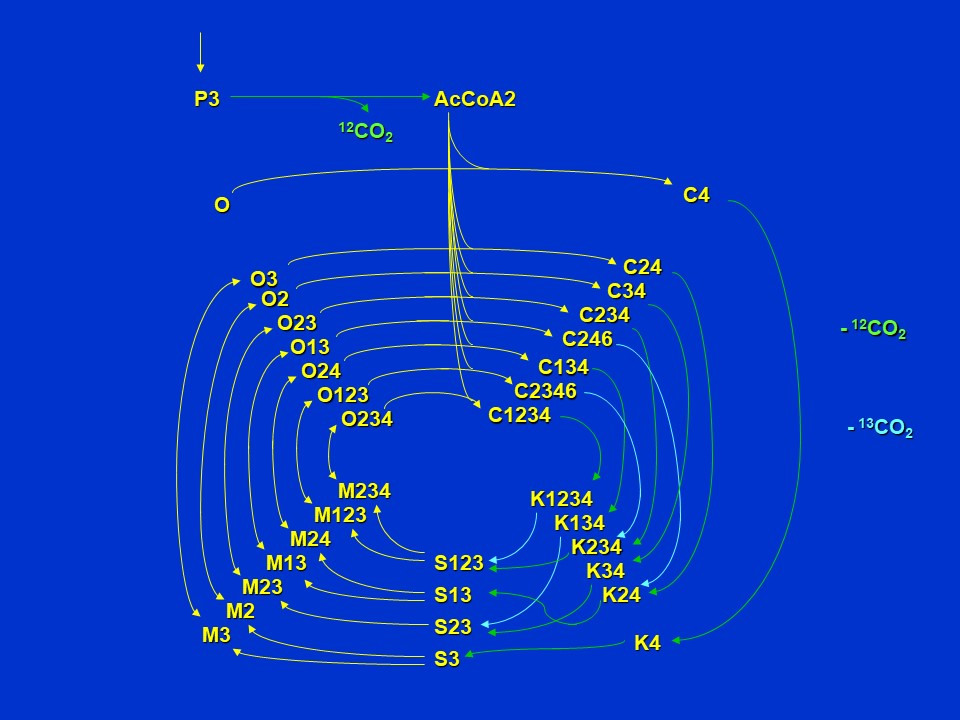
Subsequent turns of the citric acid cycle when 3-<sup>13</sup>C-pyruvate (P3) is supplied (D. Rhodes)
Now, assuming withdrawal of oxaloacetate and ketoglutarate in aspartate and glutamate synthesis and anaplerotic synthesis of oxaloacetate via pyruvate carboxylase using either <sup>12</sup>CO<sub>2</sub> from the atmosphere or <sup>13</sup>CO<sub>2</sub> generated from pyruvate respiration, there is a further increase in isotopomer diversity of pathway intermediates.
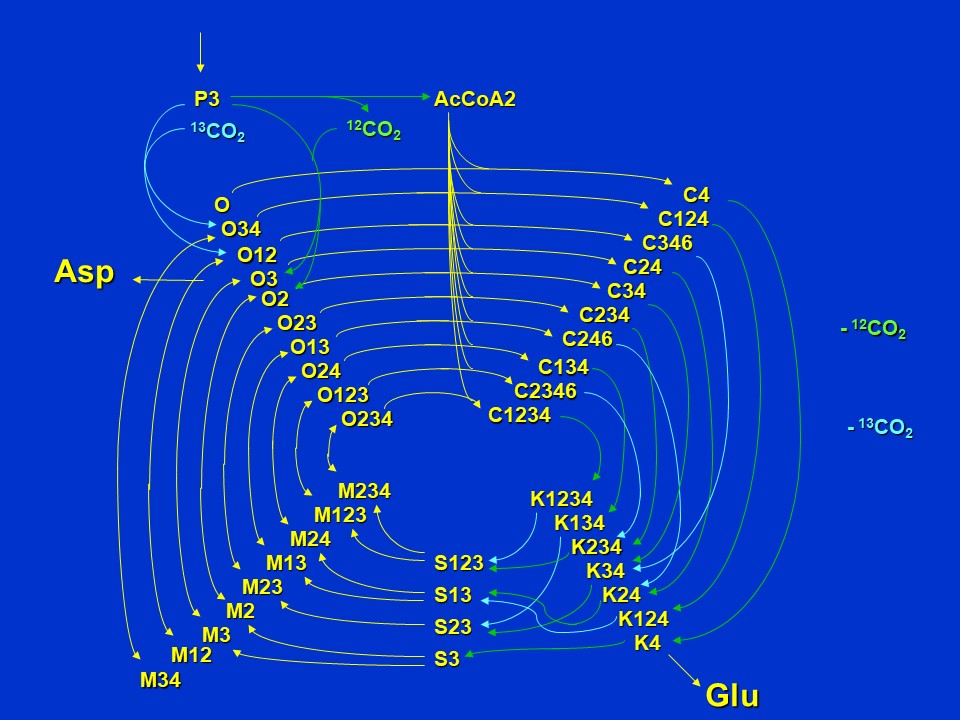
Labeling patterns of intermediates when cycle intermediates are removed for aspartate and glutamate synthesis (D. Rhodes)
**This is all mind-bogglingly complex, and we need a computer simulation model to interpret these outcomes!**
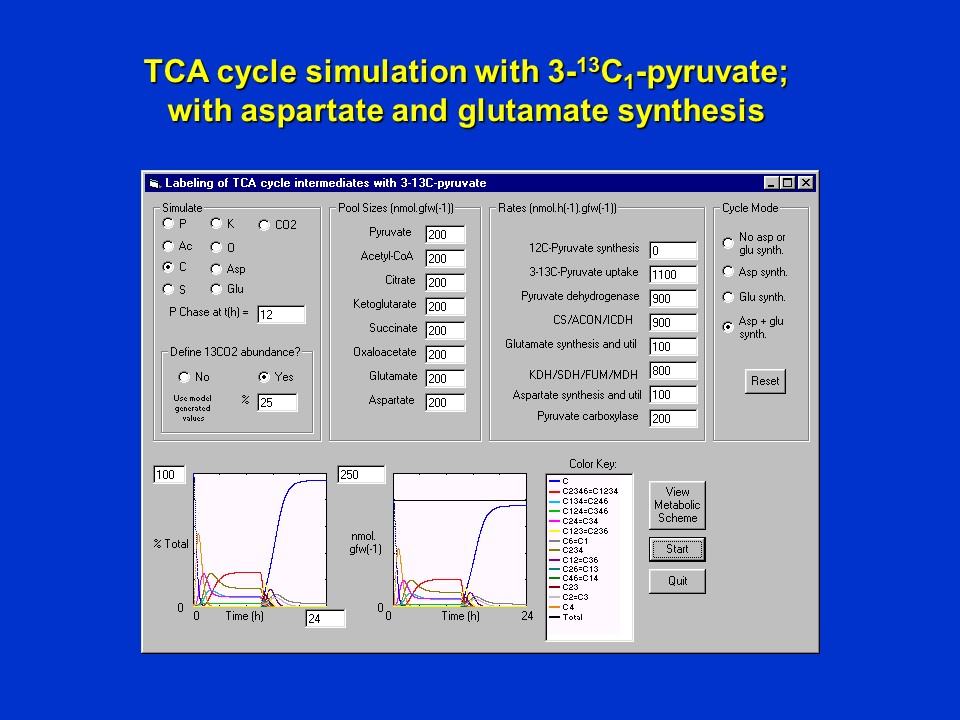
Shown below is a computer simulation of the scenario when <sup>13</sup>C-pyruvate is supplied with label in the 3 position (P3), *assuming no removal of oxalacetate (O) or alpha-ketoglutarate (K) from the cycle* for 12 h in an atmosphere assumed to be steady at 25% <sup>13</sup>CO<sub>2</sub>. At 12 h a "chase" is initiated, where <sup>13</sup>C-pyruvate (P3) is removed and substituted with unlabeled pyruvate (P), but retaining an atmosphere of 25% <sup>13</sup>CO<sub>2</sub>.
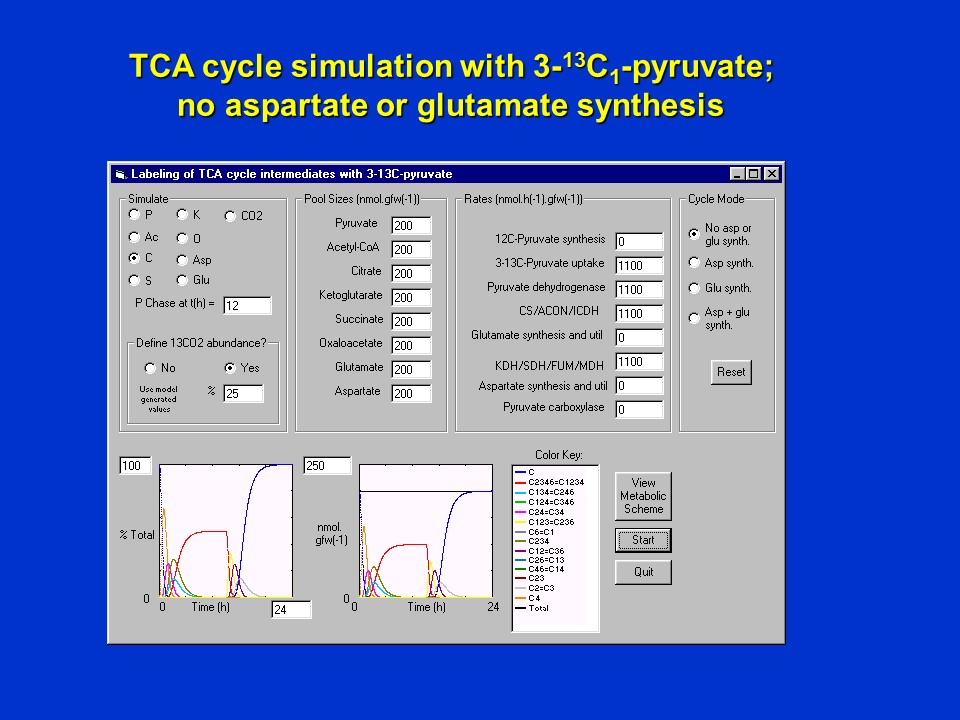
Simulated labeling of citrate when 3-<sup>13</sup>C-pyruvate (P3) is supplied in a pulse (first 12 h), and is then replaced with unlabeled pyruvate at 12 h, maintaining an atmosphere of 25% <sup>13</sup>CO<sub>2</sub> throughout. This simulation assumes **no** utilization of oxaloacetate (O) and alpha-ketoglutarate (K) in aspartate and glutamate synthesis, respectively.
Shown in the simulation output are the levels of the isotopomers of citrate (C). During the pulse-phase (first 12 h), unlabeled citrate (C) depletes rapidly, and as the citrate becomes labeled through multiple turns of the cycle, equimolar amounts of C2346 and C1234 are formed. These eventually reach a "steady-state" which is independent of the actual pool sizes of the intermediates of the pathway, and the absolute flux via the pathway. The latter only determine how long it takes to achieve a steady state! The larger the pool sizes and the smaller the fluxes, the longer it takes to achieve a steady-state.
In the chase phase (second 12 h), as <sup>13</sup>C-pyruvate (P3) is removed and substituted with unlabeled pyruvate (P), citrate isotopomers C2346 and C1234 are rapidly depleted and unlabeled citrate (C) reappears, as expected. Because no anaplerotic synthesis of oxaloacetate (O) is occurring in this scenario, no <sup>13</sup>CO<sub>2</sub> incorporation into oxaloacetate (O) and citrate (C) occurs.
Consider now the scenario in which there *is removal of oxaloacetate (O) and alpha-ketoglutarate (K) from the cycle in aspartate and glutamate synthesis*. The number of isotopomers of citrate (C) now increases and a new steady-state becomes established. The ratios of isotopomers of citrate in this steady- state is different from the one illustrated earlier, and is primarily a function of <sup>13</sup>CO<sub>2</sub> incorporation into oxaloacetate (O) and citrate (C), the fraction of the total flux that is removed in Asp and Glu synthesis, and the corresponding flux via pyruvate carboxylase required to replenish the pathway.
Simulated labeling of citrate when 3-<sup>13</sup>C-pyruvate (P3) is supplied in a pulse (first 12 h), and is then replaced with unlabeled pyruvate at 12 h, maintaining an atmosphere of 25% <sup>13</sup>CO<sub>2</sub> throughout. This simulation assumes that there **is** utilization of oxaloacetate (O) and alpha-ketoglutarate (K) in aspartate and glutamate synthesis, respectively at the specified rates.
During the chase phase, unlabeled citrate (C) reappears but does not reach 100% because the atmospheric <sup>13</sup>CO<sub>2</sub> is still maintained at 25% and contributes to citrate labeling (again dependent upon flux via pyruvate carboxylase).
**The key point about all of this, is that a steady-state is achieved and the ratios of isotopomers of pathway intermediates (and products derived therefrom) at steady-state can be used to infer flux ratios in the pathway.** If the rate of uptake of pyruvate is known (by measuring, for example, depletion of pyruvate from the growth medium), then the absolute fluxes can be calculated from the flux ratios. Particularly important is the following logic:
1. Suppose that at steady-state after feeding cells with pyruvate labeled in a specific position, and with a known <sup>13</sup>CO<sub>2</sub> abundance in the atmosphere, one extracts all of the protein from the cells.
2. Suppose that this harvested protein at steady-state is hydrolyzed into all of its component amino acids, including aspartate and glutamate.
3. Suppose that these amino acids are then analyzed by NMR to determine their steady-state isotopomer compositions.
4. Then, from all of the isotopomer ratios of these amino acids, one can back calculate central carbon metabolism fluxes from a single sample! One does not need to know individual pool sizes of intermediates or enzyme kinetic properties to make these calculations.
5. Knowledge of intermediate pool sizes is only required if one wishes to follow the time-courses of labeling of intermediates and end-products ... as noted earlier these pool sizes do not affect the steady-state finally achieved.
The mathematics of back-calculating the flux ratios from the ratios of isotopomers of end-products is described in depth by Stephanopoulos et al. (1998), and I will not attempt to describe these equations here. Suffice it to say that detailed computer programs have been developed and made available to the microbial metabolic engineering community to perform these computations.
**Essentially, microbial metabolic engineers are able to feed pyruvate labeled in specific positions to cell cultures, allow them to grow to a steady-state, harvest the cells for their protein content, hydrolyze the protein, and then analyze the protein hydrolyzate by NMR, calculate isotopomer ratios of each amino acid, and back-calculate fluxes via central carbon metabolism. This can be done repeatedly with cell cultures that have been modified genetically to assess whether the specific genetic perturbation results in a desired increase in product yield.**
For further background on the computer simulation model used to generate the time-courses of labeling of citrate described above, please see my web page: [Computer Simulation of Metabolism: Isotopomers of the Citric Acid Cycle Supplied with 3-<sup>13</sup>C-Pyruvate](https://hort.purdue.edu/CFPESP/Models/mo00013.htm).
I would like to close this article by referring back to my previous article on the citric acid cycle ([Citric Acid Cycle and Mitochondrial Electron Transport](https://steemit.com/steemstem/@davidrhodes124/citric-acid-cycle-and-mitochondrial-electron-transport)) where I pointed out that a major difference between microbial/mammalian and plant citric acid cycles is the anaplerotic pathway of oxaloacetate synthesis employed. In many microbial systems and mammals, the pyruvate carboxylase reaction is employed (as simulated above). But in plants, phospho*enol*pyruvate carboxylase (PEP carboxylase) is used instead. This will have specific ramifications concerning the labeling patterns of citric acid cycle intermediates and products (including glutamate and aspartate) when <sup>13</sup>C-pyruvate is supplied to plant tissues. I will address these consequences in my next post. Stay tuned!
*Please feel free to ask questions of comment below. I will try to answer as soon as possible*
**References**
[Deng, Y., Ma, N., Zhu, K., Mao, Y., Wei, X., Zhao, Y. Balancing the carbon flux distributions between the TCA cycle and glyoxylate shunt to produce glycolate at high yield and titer in *Escherichia coli*. Metab. Eng. 46:28-34 (2018)](https://www.ncbi.nlm.nih.gov/pubmed/29477857)
[Fatma, Z., Hartman, H., Poolman, M.G., Fell, D.A., Srivastava, S., Shakeel, T., Yazdani, S.S. Model-assisted metabolic engineering of *Escherichia coli* for long chain alkane and alcohol production. Metab. Eng. 46: 1-12 (2018)](https://www.ncbi.nlm.nih.gov/pubmed/29408291)
[Liang, F., Englund, E., Lindberg, P., Lindblad, P. Engineered cyanobacteria with enhanced growth show increased ethanol production and higher biofuel to biomass ratio. Metab. Eng. 46: 51-59 (2018)](https://www.ncbi.nlm.nih.gov/pubmed/29477858)
[Nielsen. J. Metabolic engineering. Appl. Microbiol. Biotechnol. 55: 263-283 (2001)](https://www.ncbi.nlm.nih.gov/pubmed/11341306)
[Peng, B., Nielsen, L.K., Kampranis, S.C., Vickers, C.E. Engineered protein degradation of farnesyl pyrophosphate synthase is an effective regulatory mechanism to increase monoterpene production in *Saccharomyces cerevisiae*. Metab. Eng. 47: 83-93 (2018)](https://www.ncbi.nlm.nih.gov/pubmed/29471044)
[Schwentner, A., Feith, A., Münch, E., Busche, T., Rückert, C., Kalinowski, J., Takors, R., Blombach, B. Metabolic engineering to guide evolution - Creating a novel mode for L-valine production with *Corynebacterium glutamicum*. Metab, Eng. 47: 31-41 (2018)](https://www.ncbi.nlm.nih.gov/pubmed/29522826)
[Stephanopoulos, G. Metabolic fluxes and metabolic engineering. Metab. Eng. 1: 1-11 (1999)](https://www.ncbi.nlm.nih.gov/pubmed/10935750)
[Stephanopoulos, G.N., Aristidou, A.A., Nielsen, J. "Metabolic Engineering: Principles and Methodologies". Academic Press (1998)](https://books.google.com/books/about/Metabolic_Engineering.html?id=9mGzkso4NVQC)
[Takpho, N., Watanabe, D., Takagi, H. High-level production of valine by expression of the feedback inhibition-insensitive acetohydroxyacid synthase in *Saccharomyces cerevisiae*. Metab. Eng. 46: 60-67 (2018)](https://www.ncbi.nlm.nih.gov/pubmed/29477860)
[Wiechert, W. <sup>13</sup>C metabolic flux analysis. Metab. Eng. 3: 195-206 (2001)](https://www.ncbi.nlm.nih.gov/pubmed/11461141)
[Wynands, B., Lenzen, C., Otto, M., Koch, F., Blank, L.M., Wierckx, N. Metabolic engineering of *Pseudomonas taiwanensis* VLB120 with minimal genomic modifications for high-yield phenol production. Metab Eng. 47: 121-133 (2018)](https://www.ncbi.nlm.nih.gov/pubmed/29548982)