<div class="text-justify">
Continuing learning in academy, today i am writing homework task for professor @kouba01 which is about Williams R% Indicator.
***
# Explain the Williams %R indicator by introducing how it is calculated, how it works? And what is the best setting? With justification for your choice.
***
Williams %R (percent range) indicator is a momentum indicator developed by Larry Williams to provide various market signals so as to assist traders in making appropriate trading decisios. WPR **compares** the current price of an asset to its high - low range over a specified period of observation as per formula discussed below. WPR has been arbitrarily quantified between 0 to -100 and classified into different zones like overbought and oversold.
When price enters overboght zone, it indicates that the current price of an asset is approximating the higher high over period of observation. Similarly, when price of an asset enters oversold zone, it indicates that the current price of an asset is approaching its lower low over a particular time frame .
### Calculations of Williams %R indicator.
[Source](https://www.investopedia.com/terms/w/williamsr.asp)
In the screenshot above, formula of Williams percent R indicator has been given , taking into the consideration 14 days period of observation. Now I'll be practically demonstrating how to calculate it. I have taken ETH/USDT chart over 1 day time period for 14 days.
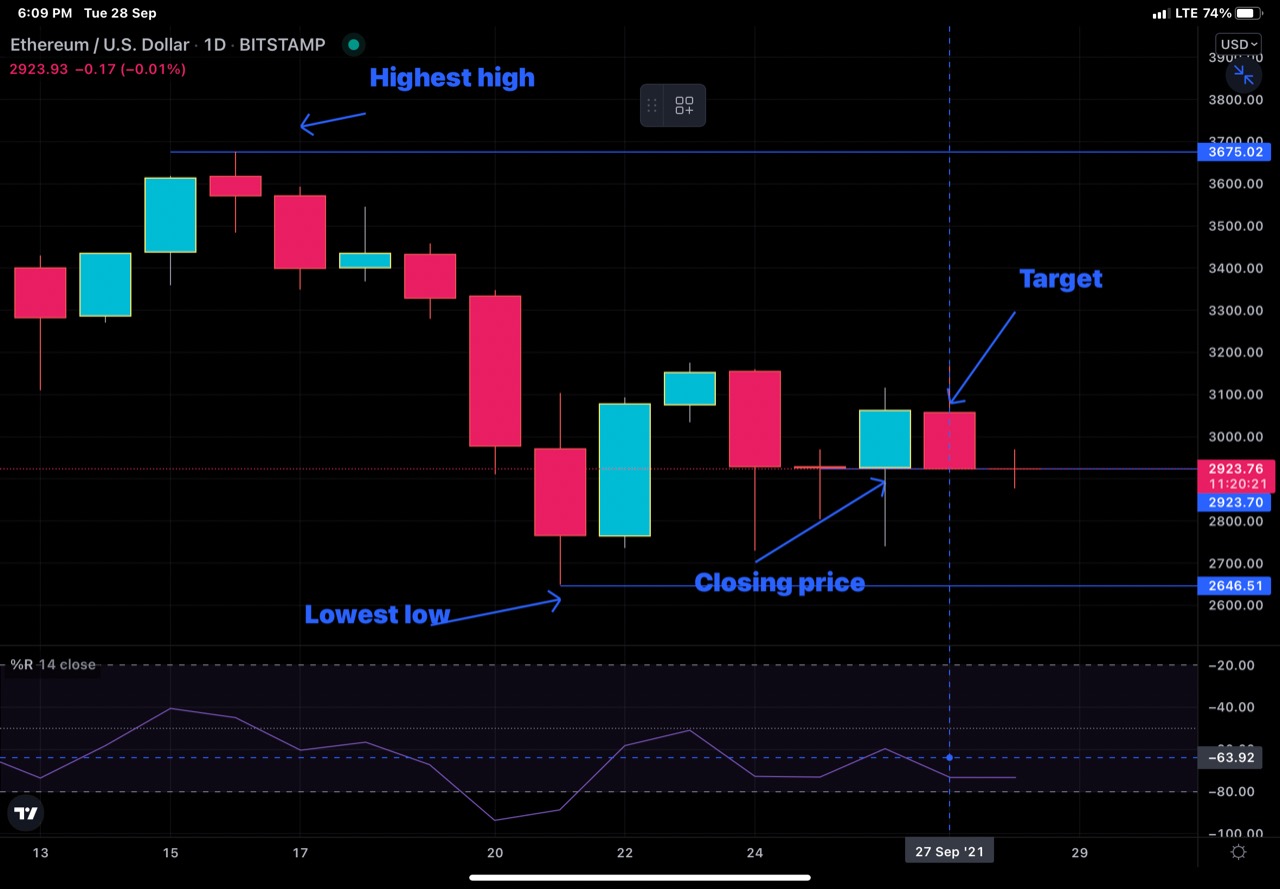
<sup> ETH/USDT chart over 1day time frame for 14 days period of reference</sup>
My target is to calculate Williams percent range indicator for the candle shown with the arrow as target. For that i have marked highest high , lowest low over the previous 14 days and closing price of the recent candle.
Highest high made by ETH over last 14 days = 3675 USDT.
Lowest low made by ETH over last 14 days = 2646 USDT
Closing price of the recent candle = 2931 USDT
Williams percent R indicator = 3675 - 2931 / 3675- 2646 multipled by -100
% R = 744/1029 x -100 = -72% (ignoring decimals)
We can see that %R value for the target candle is exactly same as calculated (ignoring decimals)
### Best settings
Most common and default time period used is 14 days. However, it can be changed as per trader's convienence and expertise. Best setting would actually depend upon trading strategy. For example, an intraday trader who wish to square off within a day won't be benefitted much by even an hour time frame because a 14 hour old candle making higher high or lower low won't impact much as intraday trader needs analysis of 5 min, 10 min or 30 min time frame. Similarly, a swing trader willing to enter for a day or two would be benefitted by an hour time frame so as to draw inferences from 14 hours. For him using a day timeframe won't be effective. So for short term traders smaller time frames are effective and for long term traders larger time frame should be used.
***
## How do you interpret overbought and oversold signals with The Williams %R when trading cryptocurrencies? (screenshot required)
***
To understand the overbought and oversold zones on the basis of Williams percent R indicator , we need to understand the morphology of the indicator. As mentioned above, the value of Williams R indicator oscillates from zero to mimus hundred. These quantified values are morphologically manifested by two important levels marked as -20 and -80.
When the value of Williams percent range indicator is between -80 to - 100, it indicates the oversold zone of an asset under consideration for that period of observation. On the contrary, when the value of William percent R indicator is between - 20 to 0 , it signals overbought zone of the asset under consideration for that period of observation.
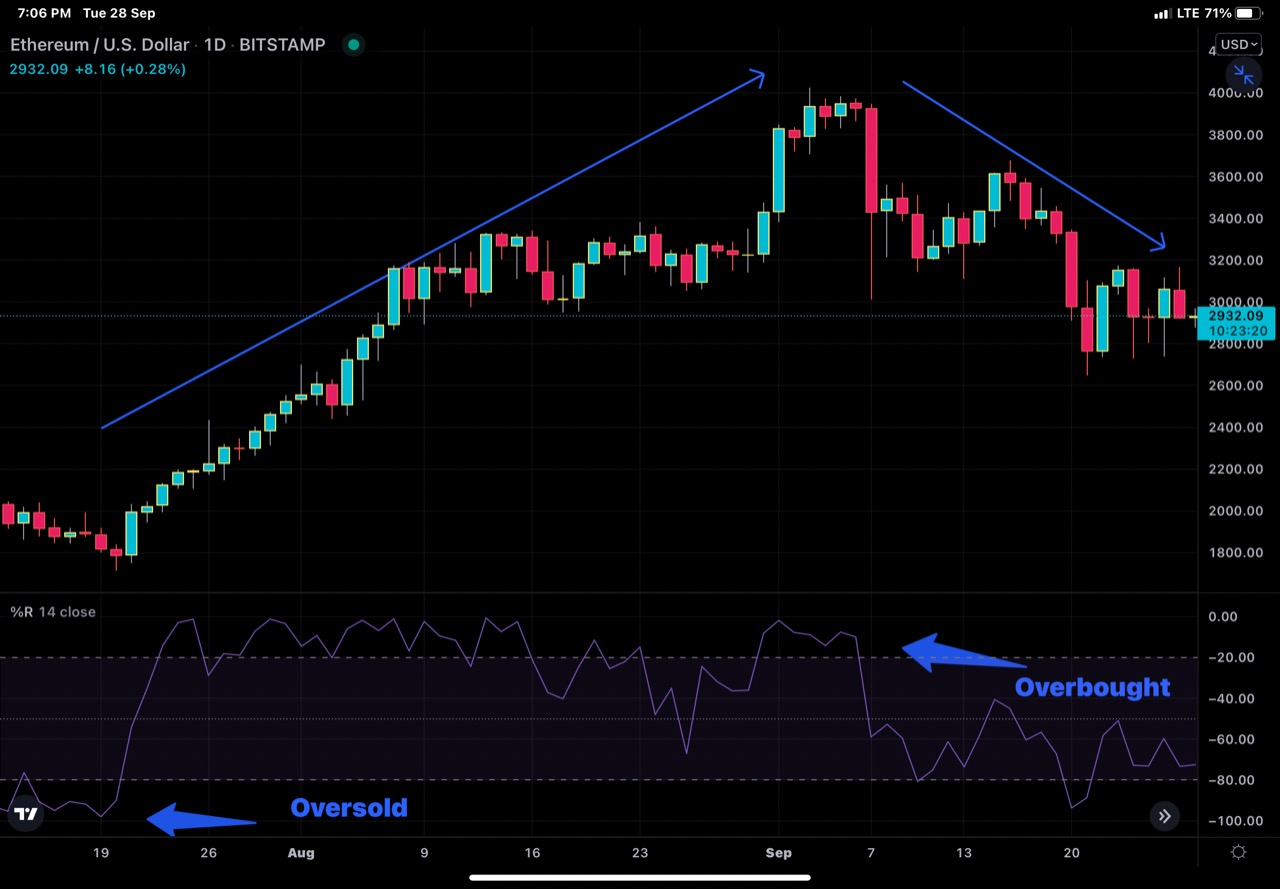
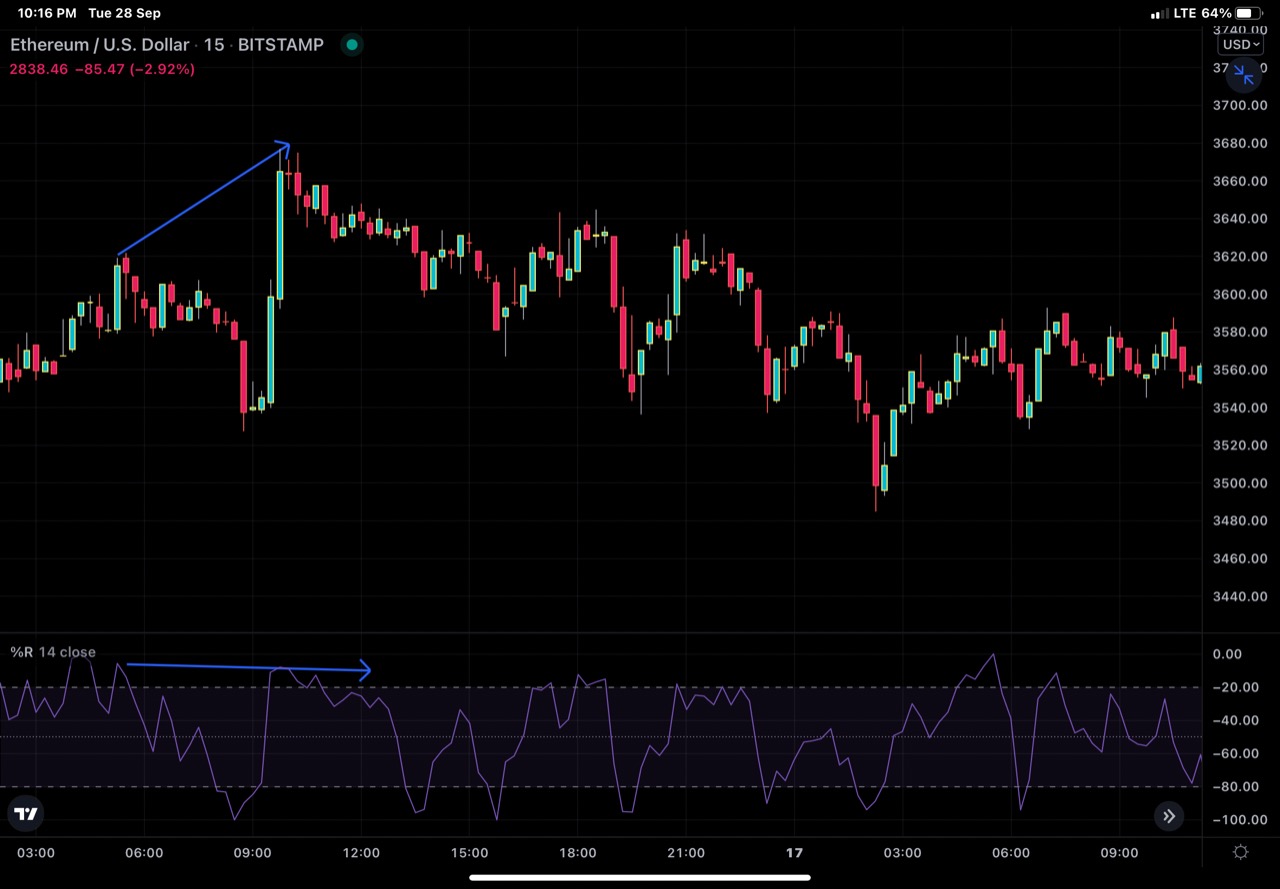
<sup> ETH/USDT Chart showing overbought and oversold zones</sup>
In the screenshot above, we can see that as indicator moves down below minus 80 (oversold zome) , it is followed by a subsequent bullish rally of price. Similarly, we can see that as indicator enters overbought zone ( above minus 20] , it is followed by drop in price.
***
### What are "failure swings" and how do you define it using The Williams %R? (screenshot required)
***
Failure Swings refers to those movements of the Williams percent R indicator that fail to move in a desired direction which we anticipate it to. Swing failures results due to weakness of the trend in that particular direction due to which it is not able to cross the desired level and turns back. For example, in a bullish market where price action is making bullish upstrokes but Williams indicator fail to cross-20 line and return its way back towards more negative zone , then that is failure swing of Williams indicator in a bullish market. On the contrary, in a bearish market where we expect Williams percent R indicator to go below -80 as per price action chart , if it fails to go down below -80 and retraces its path then we call it failure of Williams R indicator in a bearish market.
We can understand it in other way. In terms of price action, swing failure in bullish market reflects the weakness of the bulls to push the price higher and dominance of beers over bulls and their success to pull back the price. On the contrary, swing failure in bearish market indicates the weakness of bears to push the price down and dominance of the bulls over the bears and their success to push price up.
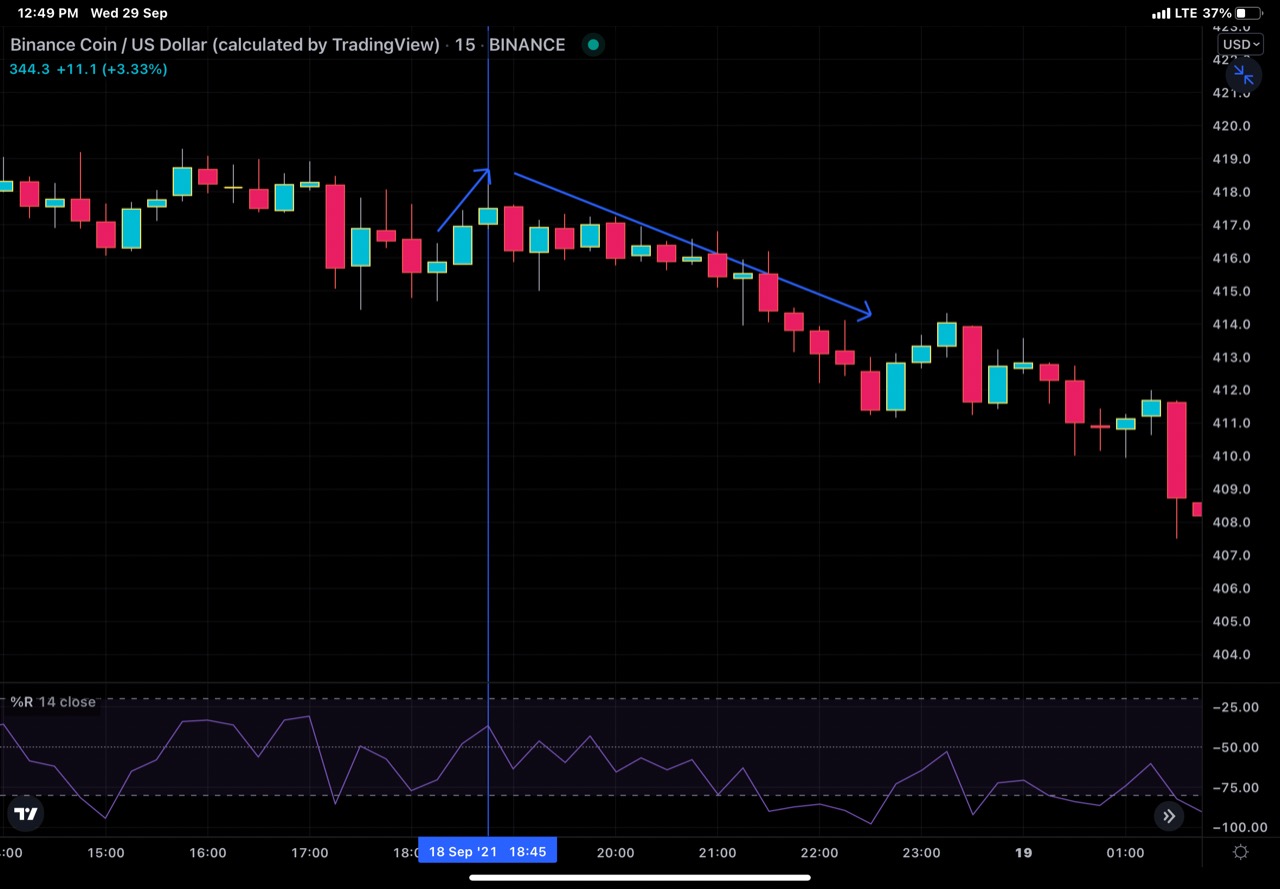
<sup> BNB/USDT chart showing failure signal </sup>
Practical utility of swimg failures is emphasised by its potential to generae signals like Biy/sell.
A sell signal is identified when a swing failure materializes wheeas buy signal is indicated by a swing failure.
***
#### How to use bearish and bullish divergence with the Williams %R indicator? What are its main conclusions? (screenshot required)
***
Divergences in case of indicators are used as buy and sell signal and divergences are named on the basis of the trend shown on the indicators not on the price action and reflect the direction of the price movement thereafter.
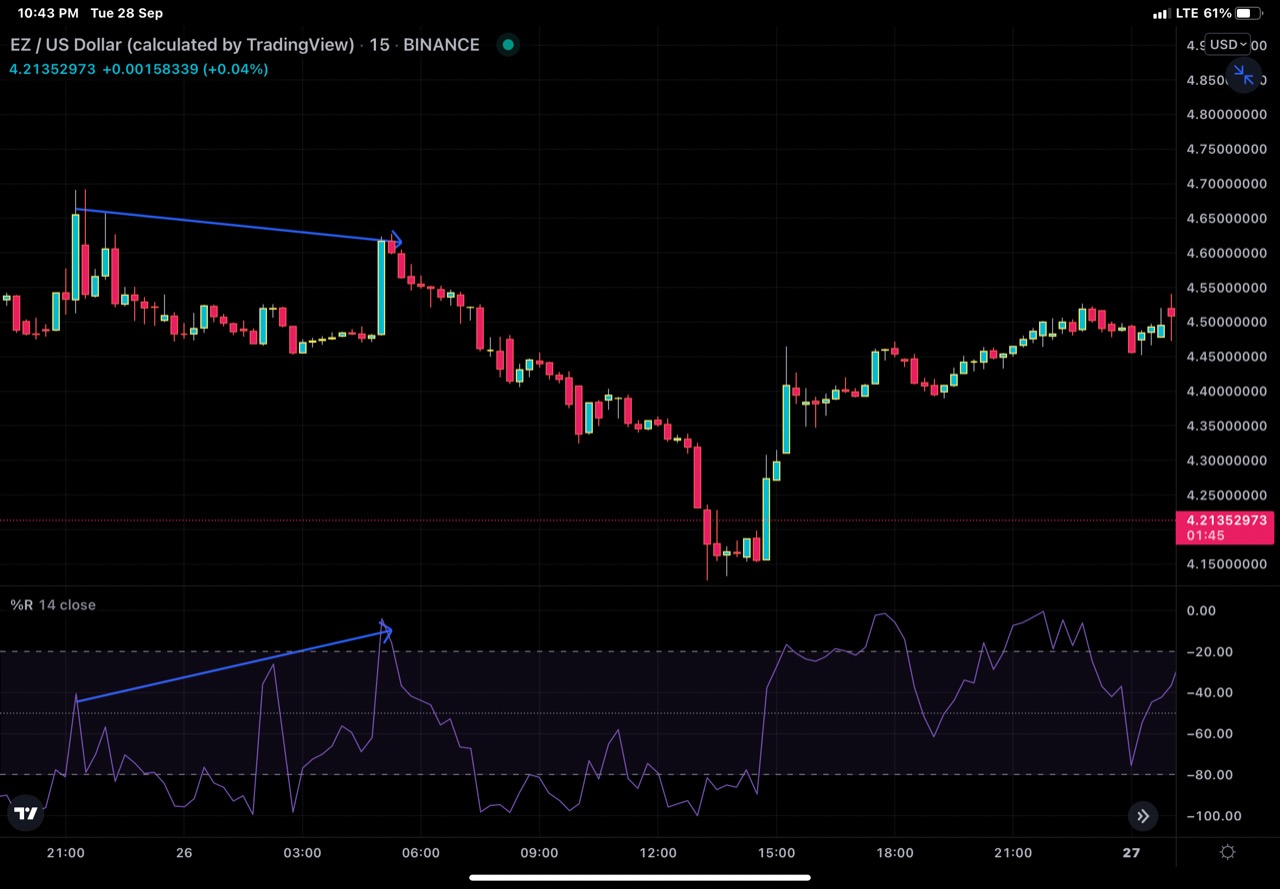
<sup>EZ/USD chart snowing bullish divergence </sup>
To put it simply, bullish divergence in case of Williams percent R indicator means that the indicator is showing bullish momentum of price while as price action is not following the indicator or we can say, indicator is up while price falls. It can be understood as decreasing strength of the bears or weakness of the beers to push the price down and therefore signals the forthcoming price hike and it is a bhy signal .
<sup>ETH/USD showing bearish divergence</sup>
Bearish divergence refers to a downtrending indicator in case of an upgoing price. It can therefore be interpreted as weakness of the bulls to pull the price up and anticipates the price fall and therefore is a sell signal.
#### Conclusions
* Bullish divergence reflects forthcoming bullish trend.
* Bearish divergence reflects forthcoming bearish trend.
* When used along with other trend confirmation indicators, divergences help us to spot pivot trading points.
***
##### How do you spot a trend using Williams %R? How are false signals filtered? (screenshot required)
***
To spot a trend on the basis of William %R indicator, we have many parameters to look at like trend reversal based on signal failures, strength of trend and divergence etc.
Failure of swings indicate forthcoming trend reversal. So if we can spot out the *signal failure*, we can spot out the new trend.
Similarly, concept of divergence as discussed above is an indicator of trend also. If we can spot out the divergence, it means we can anticipate the trend.
Next we can understand the strength of the trend on the basis of values of the indicator . If the value of Williams %R is above -50, it means the bullish trend is good in strength . Similarly if the value of percent indicator is more negative and the price rally is following a bearish momentum, it means that bearish trand has a good strength.
We must also keep in mind that no indicator is 100% accurate therefore confirmation of the signal should be considered by using multiple indicators. We should not rely on one indicator and same holds true for percent R indicator as well. In addition to confirmation of the signal , use of multiple indicators also help to filter out the false signals generated by the indicators.
We will make use of exponential moving average 14 periods to spot the false signals.
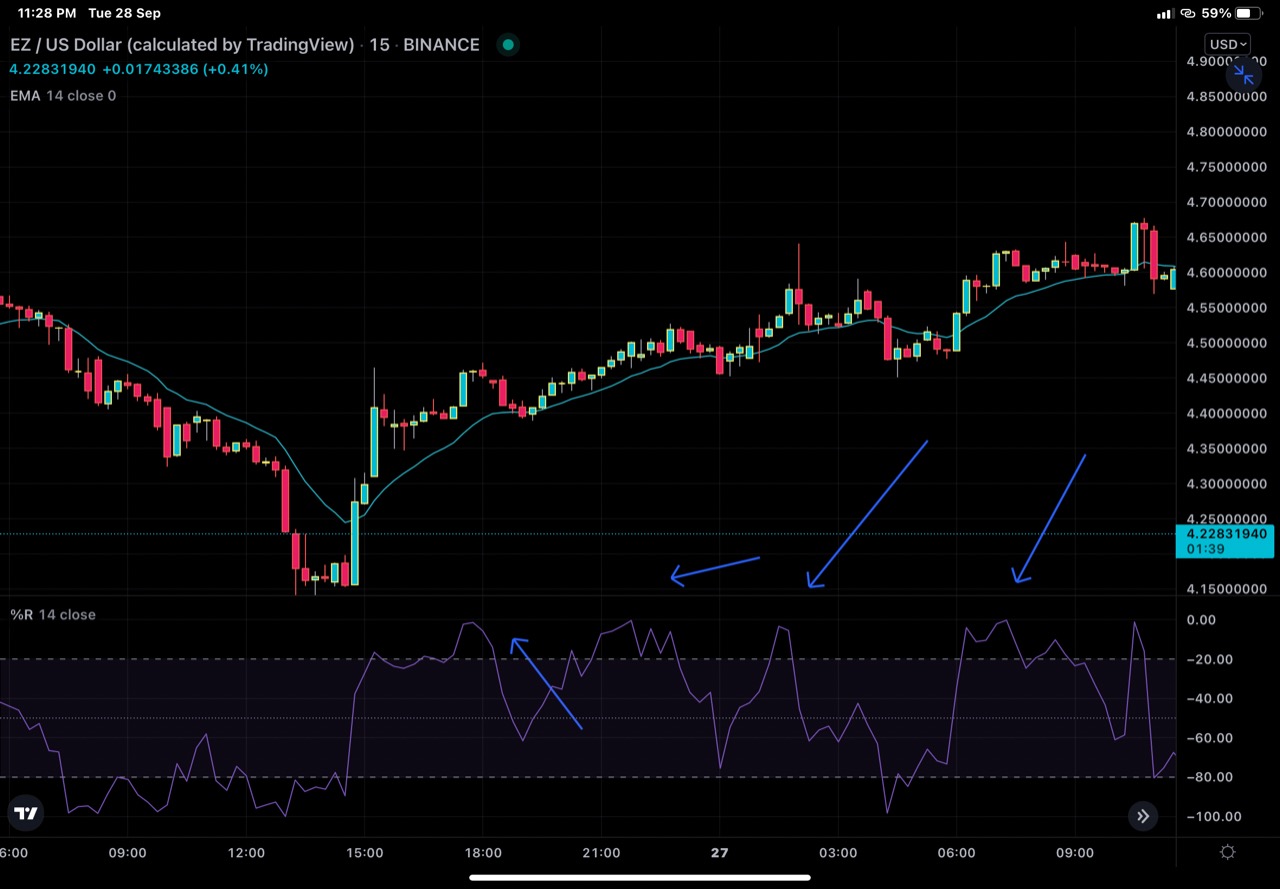
<sup> EZ/USD chart on 15 min time frame with%R and EMI 14 </sup>
In the screenshot above, we can see that multiple sell signals are generated by %R indictator. If a trader uses %R indicator alone, he would have missed a huge bullish rally of price. When used in conjunction with EMI-14, most of the false signals generated by %R indicator alone would have been filtered out.
***
##### Use the chart of any pair (eg STEEM/USDT) to present the various signals from the Williams %R indicator. (Screen capture required)
***
Various signals that are generated by %R indicator are overbought /oversold zomes, divergences to indicate trend reversal and ultimately the buy and sell signal. Despite the various trading parameters that can be reflected by %R imeicator, traders are more concerned about entry/exit or buy/sell points.
#### Buy signal
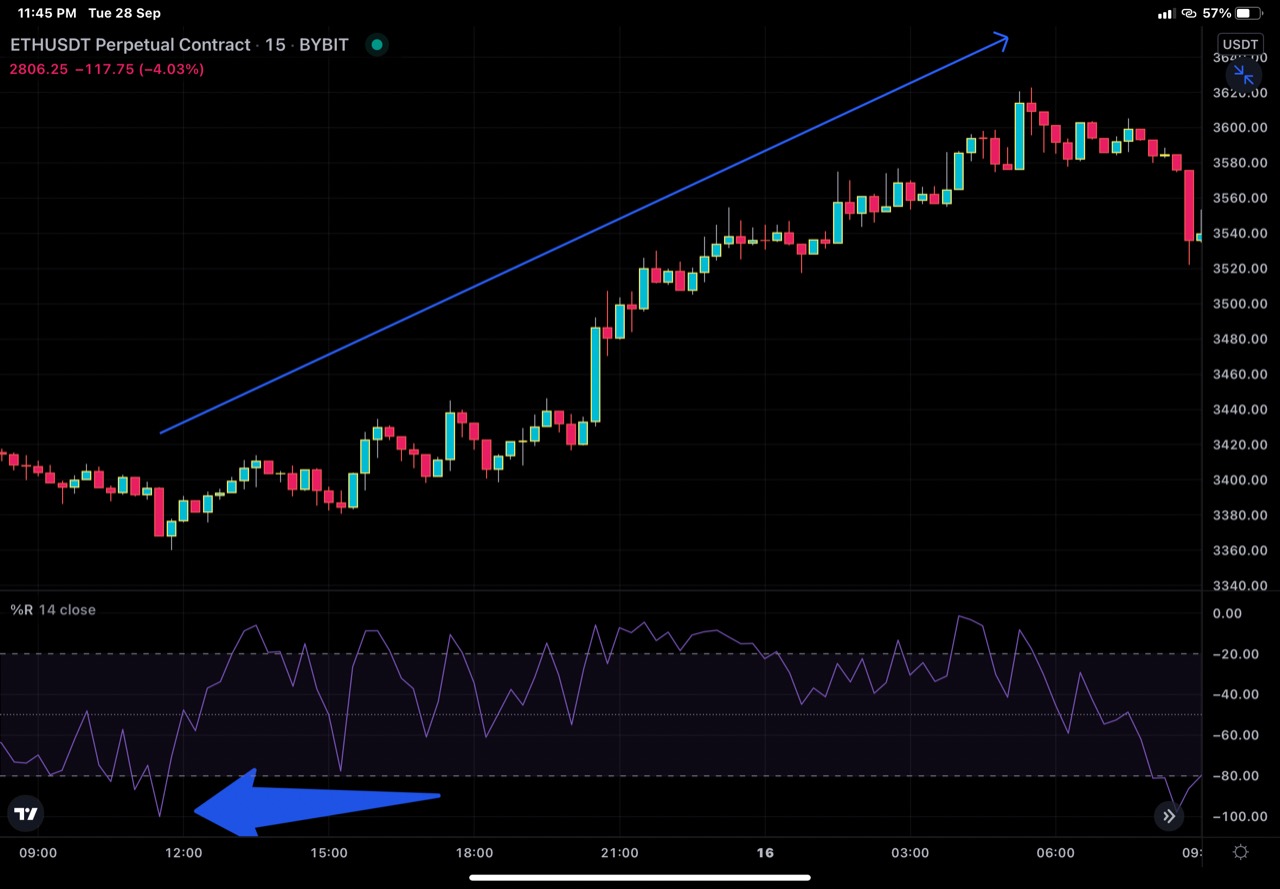
<sup> ETH/USDT showing oversold zone</sup>
In the screenshot above , we can see that as the value of WPR indicator falls below -80 (oversold zone) , it indicates decreasing selling pressure and is therefore a buy signal after price has started moving up.
#### Sell signal
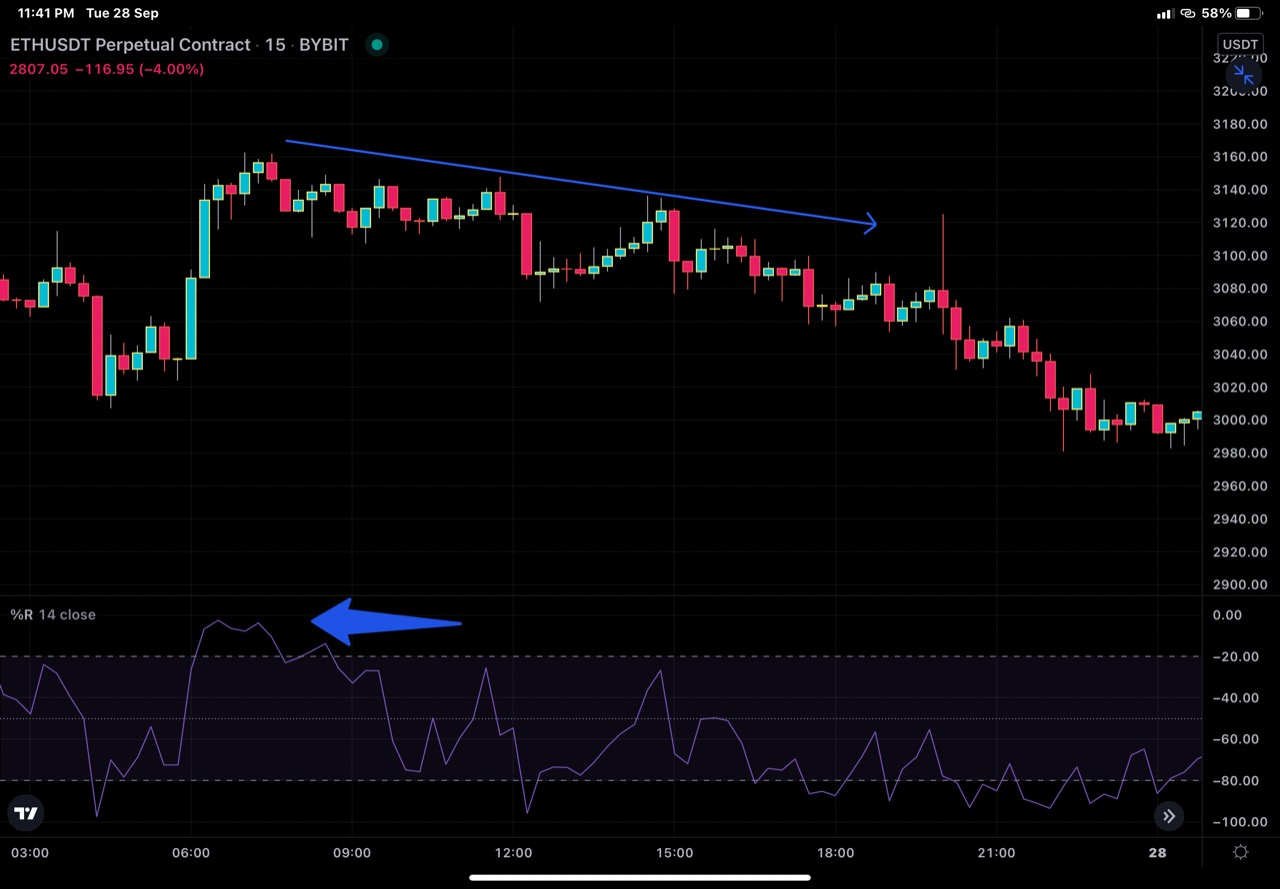
<sup> ETH/USD on 15 min timeframe showing overbought zone</sup>
In the screenshot above, we can see that as price of asset enters overbought zone (above -20} , it is a buy signal to be followed only when bullish rally of price has started.
***
###### Conclusion
***
Williams percent range indicator is a type of momentum indicator that provides various trading signals like buy/sell on the basis of comparative price analysis carried out over specified period of time. Just like all other indicators, it has pros and cons. When used along with other indicators, it is a potential tool in the hands of traders to analyse the market and spot trading signals to maximize the profits and minimise the loss. It can be used in any market and over any time frame.
</div>